Digestible investing insights
  • Do Your Research
  • YouTube
  • Podcast
  • Investor Hubs
    • Starter Investors Hub
    • Dividend Seekers Hub
    • The Risk Hub
    • COVID-19 Investing Hub
  • Sign Up
  • Boot Camp

Get Detailed Fundamental Research

Join 80k+ investors on our free newsletter and Stock Card platform who learn the tactics and receive tools to make fundamental investment decisions confidently and efficiently.
Join Us
We only ask your name and email address.

Where is the market headed?

4/9/2020

 
Today, during a brainstorming session at Stock Card HQ (virtual HQ), we were discussing the seemingly irrational movements of the market during the COVID-19 crash. Our very own Karen Sheng, Head of Data Science, who happens to be a professional trader too, walked us through her analysis as to where the market is headed. We thought you would also enjoy reading it. Thank you, Karen! 

​Reflection on the market from the perspective of a technical trader: The outbreak of COVID-19 and the subsequent nationwide shutdown has been a catalyst for an unprecedented correction of the stock market in a very compressed time frame. Hindsight is always 20/20. This post intends to shed some light on the market behaviors from the perspective of technical analysis. The primary tool used for this analysis is a Fibonacci retracement, which is commonly used to identify support and resistance levels. As we wrapped up a shortened trading week on April 9th, the S&P index was a few ticks away from a critical pivot point, the 50% retracement level at 2793.28. In plain English, the index has recovered approximately 50% from the recent swing low at 2194.83. 
Picture
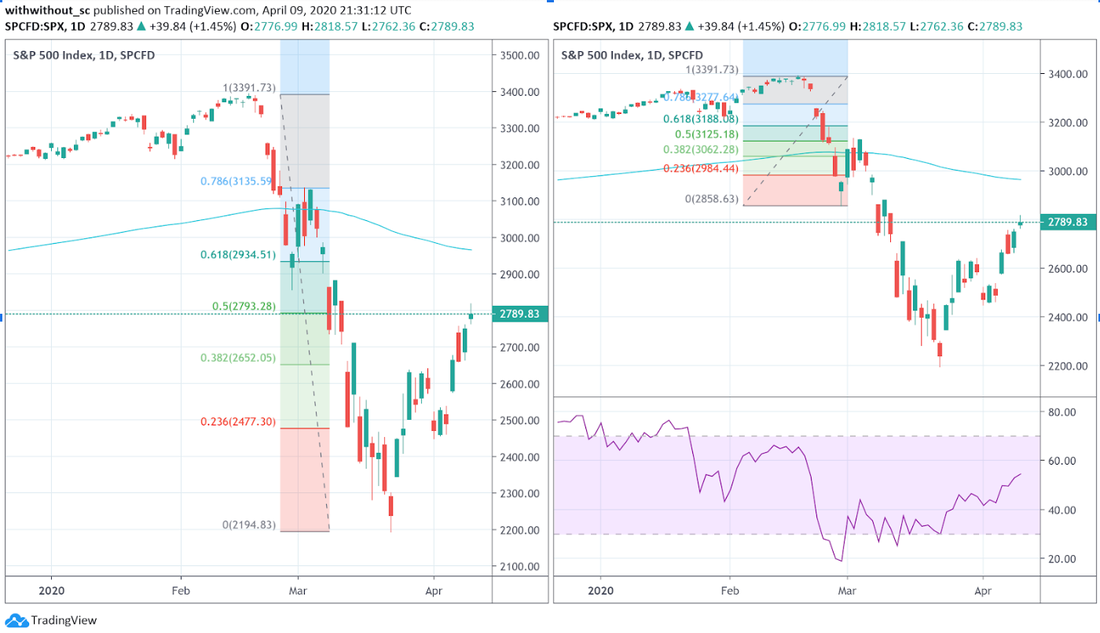
Where is the market headed to post-Easter? The nuanced answer is that, as a retail investor or trader, we don’t know; however, the Fib levels give us some guidance on where the target is going to be either way. If the market breaks through the resistance, the next resistance level is around 2934. On the other hand, it’s also likely that the index will pull back and test a new low. 

Is there any evidence for such observation? For the short swing immediately after the all-time high, the index hit the 50% retracement level at 3125 and “puked” afterward. 
​
What are the implications for investments? When the market plummets, an average investor would not know where the “bottom” is. However, cost-averaging in the accumulation of stocks in the sectors that are more resilient to the shutdown (e.g., tech sector) could have yielded at least some modest short-terms gains. When the market appears to be rallying again, it’s crucial to fend off the euphoria sentiment (“The bull market is back!” news headlines) and be aware of the resistance and possible pullbacks.

Don't forget to look up the Stock Card of your favorite companies, and while you are at it, make sure to visit our COVID-19 portfolio.
Visit Our Covid-19 Portfolio

Comments are closed.

    RSS Feed

    Join Us!

    Join 80K Stock Card users to get these Weekly Fundamental Researches and access Stock Card platform!
    Join Us
    We only ask your name and email address.

    Archives

    May 2023
    April 2023
    March 2023
    December 2022
    September 2022
    July 2022
    February 2022
    November 2021
    October 2021
    September 2021
    August 2021
    July 2021
    June 2021
    May 2021
    April 2021
    February 2021
    October 2020
    September 2020
    August 2020
    July 2020
    June 2020
    May 2020
    April 2020
    March 2020
    January 2020
    October 2019
    July 2019
    June 2019
    May 2019
    April 2019
    March 2019
    February 2019
    January 2019
    December 2018
    November 2018
    October 2018
    September 2018
    August 2018
    July 2018
    June 2018
    May 2018
    April 2018
    March 2018
    February 2018
    January 2018
    December 2017
    November 2017

    Categories

    All
    Battle
    Education
    ETF Investing
    Fundamental Analysis
    How To Invest
    New Podcast Episode
    New Portfolio
    Portfolio Update
    Starter 2020
    Stock Card VIP Pick
    Stock Lists
    The Daily Hype
    Update
    Watchlist Worthy
    Winners And Losers

© 2023 StockCard.io. All Rights Reserved.
​​
Disclaimer: StockCard.io is not, neither operated by a broker, a dealer, or a registered investment adviser. Under no circumstances does any information posted on StockCard.io and Stock Card Weekly represent a recommendation to buy or sell a security. The information on this site, and in its related newsletters, is not intended to be, nor does it constitute, investment advice or recommendations. The Stock Card team may buy and sell securities before and after any particular article and report and information herein is published, with respect to the securities discussed in any article and report posted herein. In no event shall StockCard.io be liable to any subscriber, visitor, guest or third party for any damages of any kind arising out of the use of any content or other material published or available on StockCard.io, or relating to the use of, or inability to use, StockCard.io or any content, including, without limitation, any investment losses, lost profits, lost opportunity, special, incidental, indirect, consequential or punitive damages. Past performance is a poor indicator of future performance. The information on this site, and in its related newsletters, is not intended to be, nor does it constitute, investment advice or recommendations. The information on this site is in no way guaranteed for completeness, accuracy or in any other way.
  • Do Your Research
  • YouTube
  • Podcast
  • Investor Hubs
    • Starter Investors Hub
    • Dividend Seekers Hub
    • The Risk Hub
    • COVID-19 Investing Hub
  • Sign Up
  • Boot Camp