Master your fundamental research. Join 79,627 investors who trust our platform and content.
Save 54+ hours of fundamental research with free access to Stock Card.
We only ask your name and email address.
|
Picture this: You go to YouTube, look up your favorite YouTuber, and he gives you one or two stock picks to feel excited about. Before you close the app, YouTube recommends another video titled "Best Stock Picks This Year," you watch it, adding a few more stock picks to your list. You promise yourself you come back and research them next weekend. But before you go to bed, a quick scroll through Twitter adds a few more ideas to your list, and just about the time you think you can't handle any more stock ideas, a breaking news article on CNBC adds a new ticker to the top. At best, you research a few haphazardly and skip the rest, and at worst, you forget about the list and repeat the same process the next day.
This stock-picking dance happens to all of us more often than we care to admit it. It is quite damaging to our success as long-term investors. In today's blog post, I'll share a process that can help you take control of your stock-picking process. It's simple and effective; anyone can use it, and it puts you in control and it is based on how Warren Buffett recommends you pick stocks. Let's talk about that! 
I'm Hoda Mehr, founder, and CEO of Stock Card, and on this blog and its accompanying YouTube channel and Podcast show, I share detailed fundamental analyses and interesting investment stories.
This post is part of our educational series to help you hone your fundamental investing skills. Catch up with the other post on How to Invest Like Buffett ?. Remember, this content is for education and sharing ideas and not advice to buy or sell any securities. Sign up for a free account on Stock Card to get notified of these blog posts, YouTube videos, and Podcast shows every week. We only ask your name and email address when you sign up.
The starting point of this template is how Warren Buffett recommends you pick stocks. After we understand how he does it, I'd share a more practical and useful template you can use to find stock picks according to his methodology but in the modern day and age.
Warren Buffett's Approach: On several occasions, investors have asked what he would do if he had a small amount of money and wanted to make lots of money in the stock market. His answer has two parts:
To pick stocks following Buffett's suggestion, I have devised a framework I call a three-legged stool with a flower vase. Market Cap Filter
This typically refers to a company with a market cap of at least $50 Million or above but lower than $10B. Chris Myer, the author of the 100-bagger book, explains this best. Chris has looked through companies created more than 100 times in return between 1962 and 2014 and found the most common characteristics of such companies. The idea is that smaller companies can grow ten or 20 times, still be small, and have room to grow over the year. In contrast, Apple today has a roughly $1Trillion market cap. We can safely assume it won’t go up 10 or 20 times and certainly not a hundredfold. So for us long-term investors buying companies to hold for 3, 5, or 10 years and, in return, expect to get rewarded significantly, we have to focus on smaller companies.
How to find them? It's one of the easiest criteria to screen for. You go to Stock Card's stock screener tool, and choose the market cap filter, and remove companies with less than $50M and more than $10B in market cap. Please notice this would exclude very good investments such as Airbnb or Nvidia. But, notice, here we are focusing on finding companies that don't trend, and also, we are looking for companies that truly deserve to be held for a decade. Nvidia is a great company, but we all have exposure to Nvidia, either through holding broad market indexes such as SPY or some other ETFs. Revenue Growth Filter
We've often heard that fundamental investing is picking businesses, not stocks. This means we must have a few criteria to differentiate a good company from a crappy one. If there is only one filter we should pay attention to, we should focus on revenue growth or a company's ability to grow revenue. Without revenue growth, it is very hard to attract talent and capital, and the company starts to shrink and decline, especially if the plan is to hold the stock for 3, 5, or 10 years, this criteria becomes super important.
How to find them? One simple way to look at it is to just look at companies who grow their revenue in the last 12 months. But businesses are like humans, they have good years and bad. You can't just judge them based on one year's performance. You want a company that has been able to grow most of the time, with some flexibility for slower growth in a quarter or two. I prefer looking at the company's annualized revenue growth in a 3-year. On Stock Card's screener, if you choose the "Solid Revenue Growth" filter, it is based on the company's revenue growth in the last quarter over quarter, year over year, and 3-year period. Looking at all three periods, Stock Card allows for flexibility in revenue growth interruptions if a company has a bad quarter. Cash Generation Filter
What's the most important reason businesses exist? I wait a few seconds for you to think about this. If you said making money, you are spot on. Yes, businesses exist to make the world a better place, innovate to solve problems, bring a dream to reality, and so on, but at the end of the day, the ultimate goal of any business is to make money.
How to find them? We can use net income or profit that companies report at the end of the profit and loss statement. However, net profit results from accounting rules that don't always show the company's cash generation power. Instead, free cash flow is a better indicator of a company's ability to generate cash because it excludes non-cash expenses such as stock-based compensation and includes cash expenditure on capital expenditures. It shows the true power of a company in making money. On Stock Card's screener, if you choose the "Cash Availability" filter, it is based on the company's free cash flow and its growth in the last quarter over quarter, year over year, and 3-year period. Looking at all three periods, Stock Card allows you to filter out companies that aren't truly cash-generating.
Those three filters are foundational to your long-term stock screening. However, they are not the only screeners you have to use, but it take the universe of more than 21K stocks listed in the U.S. down to around twelve hundred stocks on the day of recording this session for you.
Now, for the next part of our discussion, let's focus on how you can further narrow down the list from 12 hundred stocks to a few. If it were young Warren Buffett, he would have started researching the full list. But let's accept that with the help of technology, we can be much more efficient than Buffett. Two Additional Filters To Screen Stocks Like Buffett
First off, there are super easy ways to cut things out.
Now, we have a screener that gives us about 100 stocks or so that are worth researching and spending time on. It is very easy to take this screener and make it more personal to your investment strategies. For example, if you want a company to be profitable or rather invest in undervalued stocks, those are additional criteria you can add. This is the link to the screener I created in this blog post: Click Here. You can save it to your Stock Card account and adjust it to your liking, if you are on the mission to invest like Buffett! I'll see you next time!
Michael Burry, the man who foresaw the 2008 housing market crash, has seemingly decided to short the entire stock market once again! Despite his fame, Burry isn't that good at predictions if you follow some of his forecasts in recent years. But he is a very observant investor and makes logical arguments about discrepancies he sees between fundamentals and prices. What signs and signals has he seen this time around that prompted him to take such a daring stance again? And are there reasons to believe him this time and take similar actions to short the market and save our portfolios?
Let's talk about that! 
I'm Hoda Mehr, founder, and CEO of Stock Card, and on this blog and its accompanying YouTube channel and Podcast show, I share detailed fundamental analyses and interesting investment stories.
This post is part of a series I started a few weeks ago to fundamentally research companies to manage my real-money portfolio. I've already researched Canopy Growth (CGC), Fastly (FSLY), Snap (SNAP) , Shopify (SHOP), Airbnb (ABNB), Unity (U), JD.com (JD), NVIDIA (NVDA) and several others. I also started sharing interesting investing-related stories. The first one was on what happens when the U.S. hit its 2% inflation target. More interesting stories are in the works. Remember, this content is for education and sharing ideas and not advice to buy or sell any securities. Sign up for a free account on Stock Card to get notified of these blog posts, YouTube videos, and Podcast shows every week. We only ask your name and email address when you sign up.
Berry shorting the U.S. market is one of those fascinating stock market stories. Whenever he makes such moves, the entire market takes note. But betting against the market isn't anything new for the big short investor. He's a pessimistic investor by nature and has made several bearish predictions since his successful bet against mortgage-backed securities during the great financial crisis.
Michael Burry's Marker Forecast Track Record
In September 2019, Michael told Bloomberg that index fund inflows were distorting stock and bond prices, and when the inflow reversed, the result would be catastrophic. His argument is correct. Over $11 trillion is invested in index funds, up from only $2 trillion a decade ago. The problem with indexes is that the decision is automatic. No one picks stocks, and money, in most cases, automatically flows into large indexes giving the stocks listed in indexes enormous price boosts. However, the prediction hasn't come to reality since 2019. For example, S&P 500 index ETF (SPY) had gone to more than $400 per share, up from $219 per share when Berry predicted the catastrophic consequence of flowing money into indexes.
In December 2020, Burry took it to Twitter (now X.com) to say that Tesla's stock price is ridiculously overpriced. Split-adjusted and despite volatility between 2020 and today, Tesla's stock price is still hovering slightly higher than its December 2020 price. Burry predicted a stock market crash in February 2021, after which the market went on for a few months of extraordinary rally thanks to the government stimulus and quantitative easing. While he was eventually correct, and we saw the rally ended in 2022, many considered his market crash predictions unreliable. Michael Burry's attention turned toward Bitcoin in March 2021, predicting a crash that was quite the opposite of Bitcon's rally to above $60,000 per coin price tag immediately after his prediction. Bitcoin price eventually crashed in 2022, but not before many lost faith in Burry's predictions. A pattern is emerging if we pay closer attention to all these predictions. Burry predicts catastrophic crashes based on logical evidence. But the markets do not necessarily follow his logic immediately. There is a time gap between when he shares his predictions and when they come true. Even in the case of Burry's bet against mortgage-backed securities, he initially saw the risks in 2005, at least 2 years earlier than the actual price drop. The secret to Burry's success is that he is patient even if the market takes the opposite direction in the short to mid-terms. Back to his latest put options, Michael Burry had purchased put contracts with an unknown strike price and exercise date, seemingly betting that the SPY and QQQ (top 100 Nasdaq stocks) would go down in prices at some point in the future. Before his option contracts expire, he has the right to sell his put options at the strike price, presumably higher than the SPY and QQQ price. We don't know anything about these options' dates and exercise prices. He can be quite patient and hold his put contracts for a long time to profit from the eventual crash he predicts is coming. We can simply interpret this move as a way for Burry to protect his hedge fund against an eventual crash. But Burry isn't the only one predicting a crash. Other investors seem to agree with Burry and have shared similar bearish sentiments in different ways. Bill Ackman's Market Forecast
Fellow hedge fund manager Bill Ackman is one of those. A few weeks ago, Ackman took it to Twitter (X.com) to explain his firm's belief that the U.S. treasuries were overbought. The evidence that supports Bill's argument when he made the statement was the $14B money inflow into iShares 20+ Year Treasury Bond ETF (ticker TLT) in 2023 alone. How exactly does Bill's bearish sentiment echo Michael Burry's bearish positions?
Bill is predicting that unlike many investors expecting the Fed to start cutting down interest rates, which in turn will boost the stock market prices, the opposite may be true. Bill believes the government's massive deficit would force it to issue more debt, and for the market to buy such debt, the government has to offer higher yields, which in return may mean lower equity prices. In a way, Bill Ackman and Burry agree on the possibility of lower equity prices and are hedging their risks differently but against similar forces. Morgan Stanley's Market Forecast
A recent market commentary by Morgan Stanley’s Global Investment Committee agrees with these two assessments. In summary, the committee believes that equity investors are too optimistic about interest rate cuts in the coming months, and the bond market doesn't support such a direction. The committee believes that the effect of the COVID-era stimulus has been lingering. Only now and in the coming months will we see the impact on consumer spending and corporate profits.
Cathie Wood's Market Forecast
That's the point that other investors agree with. In her monthly In the Know Updates, Ark Invest's Chief Investment Officer, Cathie Wood, warned investors of a possible hard landing for the U.S. economy. Cathie explained that companies would face pressure on their profits and profit margins for a few reasons, including hoarding the labor force and broad agreements between employees and employers in manufacturing and airline industries to increase salaries in response to inflation and union negotiations. Cathie Wood also believes the prices will start declining, adding more pressure on the company's profit margins. Those will be the reasons to see lower economic growth in the coming months, leading to negative sentiment in the stock market.
The question we should try to answer now is whether there are economic indicators that support Michael Burry, Bill Ackman, Morgan Stanley, and Cathie Wood's stances. Recession Economic Indicators
Historically, there are a few recession indicators:
So of the four economic indicators, the yield curve is the only one predicting a recession, and we have seen at least three investors agreeing with the yield curve. It seems most economic indicators do not agree with Michael Burry, Bill Ackman, Morgan Stanley, and Cathie Wood. What do we do with this contradiction between major economic indicators and prominent investors' stance to protect their portfolios? How To Crash Proof Our Portfolios
First of all, this is a good sign. The market typically goes to the extreme when everyone agrees on the same conclusion. A healthy market results from differences in opinions and the pull and push between these bearish and bullish sentiments.
Secondly, I know these investors all seem smart. But no one can predict the market. As much as it's hard to accept it, even smart investors such as Michael Burry can be wrong or at least be early in their predictions. Bill Ackman is famous for the wrong call he made about Herbal Life, and Cathie Wood, like any other investor, has lost lots of money in the market after the COVID rally came to an end, even though she has a team of smart analysts and they follow a diligent research process. We can't just follow them blindly, they can make mistakes in their conclusions. Where does that leave us? It leaves us with the old good wisdom we are all aware of:
Those are simple actions but not easy. If the market continues to rally, you'll regret not going all in. If the market crashes, you will regret some of the investments you've made now. Whatever you do, there will be reasons to regret and feel distressed. So, accept that there is no perfect investment decision. There is always risk in investing! There is no perfect investor. Invest slowly, steadily, in things you have done your research or have confidence in over a long period of time. I see you next time!
The earnings season is in full swing, and the usual revenue and profit misses and beats come with it. But companies make all sorts of announcements during the earnings reports, and not all are revenue and profit related. Three companies made surprise announcements that are worth paying attention to, especially if you plan to invest in them or are an investor already: Palantir, PayPal, and PubMatic. Let's talk about their surprises.  I'm Hoda Mehr, founder, and CEO of Stock Card, and on this blog and its accompanying YouTube channel and Podcast show, I share detailed fundamental analyses and interesting investment stories.
This post is part of a series I started a few weeks ago to fundamentally research companies to manage my real-money portfolio. I've already researched Canopy Growth (CGC), Fastly (FSLY), Snap (SNAP) , Shopify (SHOP), Airbnb (ABNB), Unity (U), JD.com (JD), NVIDIA (NVDA) and several others. I also started sharing interesting investing-related stories. The first one was on what happens when the U.S. hit its 2% inflation target. More interesting stories are in the works. Remember, this content is for education and sharing ideas and not advice to buy or sell any securities. Sign up for a free account on Stock Card to get notified of these blog posts, YouTube videos, and Podcast shows every week. We only ask your name and email address when you sign up. Palantir's Earnings SurprisePalantir stock price is down by ~ 22% in the first 10 days of August, despite reporting a solid quarterly earnings report. Revenue was up, profits remained in the green, and the company announced the launch of its generative AI product, among other positive news. The surprise came when the company announced a $1B share buyback program. Typically, a share buyback program is quite investor friendly. It reduces the share count and creates more value for current shareholders. Companies buy their own shares for two primary reasons:
Even after the recent price drop, the stock is priced 18 times its sales, so Palantir has to grow its revenue by ~30% per year in the next 10 years to grow into such a valuation. That seems unrealistic when the company just grew 13% year-over-year in the latest quarter. Investors must be worried that the company is "wasting" its cash resource on buying shares at an overpriced level. So why is Palantir's leadership spending $1B in buying its shares? There can be two reasons:
Based on my observations of Palantir's focus on storytelling and riding the wave of the market's momentum and sentiment, I believe the decision is a part of the company's story. PayPal's Earnings SurpriseThe company released its earnings, and the stock price dropped ~6% after. There were lots of good news in the earnings, including 11% Y/Y payment volume growth and 12% transaction per active account growth. Also, the company is quite solid, fundamentally looking at the balance sheet and free cash flow. So what drove the price down? Investors are concerned about the drop in the company's transaction margin. PayPal's business isn't just the branded payment we are all familiar with. It operates Venmo and Braintree. Venmo is so popular that it has become a verb. I just parked my car in a parking lot, and the attendant told me to "Venmo" him the parking fee. It's so popular it's a verb. Braintree is a technology company that enables companies to process credit cards and other forms of payment on their website. And that business is the reason behind the lower transaction margin. For a mature company such as PayPal, profitability and maintaining or expanding is the most important metric investors look for. However, according to the management, several projects and initiatives in the works can improve transaction margin, including the growth of PayPal's unbranded check-out functionality and other value-add payment services that companies such as META and TikTok are adopting. Despite the transaction margin worries, the surprise is in the company's valuation. PayPal generates $5B in free cash flow and shared a positive earnings report and forecast for the year, but the stock is priced 17 times its earnings and 13 times in forward earnings. In contrast, S&P 500's average P/E ratio is above 20 times. Even more surprising is the company's PEG ratio. The PEG ratio takes the P/E ratio and divides it by the earnings growth rate. If the PEG ratio is above one, it means the stock valuation is higher than the speed of its earnings growth, and if lower, it shows a lower valuation than what the company deserves based on its earnings growth rate. PayPal's PEG ratio is 0.7, indicating an undervalued stock despite a fundamentally solid business. This surprising undervaluation made me add PayPal to our Beaten Down portfolio, which is a portfolio of stocks getting punished by the market due to short-term miscalculations. The portfolio's picks, on average, have overperformed the market by more than 80%. Here's the link to this portfolio in the show notes if you'd like to follow the portfolio and get notified of the new additions when we find new beaten-down stocks to add. PubMatic's Earnings' Reaction SurpriseAnd finally, the last earnings surprise comes from PubMatic (PUBM). The surprise isn't in what the company announced but in how the market reacted to the earnings report, dragging the stock price by more than 30% on the earnings day. The report wasn't stellar and came with flat revenue growth and negative GAAP net income due to a few one-time hits to the bottom line, followed by a few analysts cutting their price target for the stock. However, the report also had several early indicators of future growth. PubMatic invested and launched new products, especially in the video ad and ad supply optimization capabilities. It's already seen great traction with those new launches. It has also invested in its infrastructure to create incremental capacity without an impact on the margin. The flat revenue wasn't due to low engagement and activity but rather due to lower CPM. That means that due to overall economic concerns, advertisers spend less on ads or bid less fiercely than they used to, bringing the ad prices down and PubMatic's revenue down with it. Using common valuations metrics such as the Price to Sales or Price to Earnings ratio, the stock isn't cheap. For example, PubMatic is priced 7 times its sales. To reach 7 times sales growth, it requires 20% revenue growth per year in the next ten years. This revenue growth was once quite normal for PubMatic, but it feels quite out of reach compared to the last few quarters. Ultimately, it is still feasible if the advertising spending goes back to growth, and the company's new product launches should help. Also, high profit and the company's focus on strong free cash flow would help it grow into its current valuation. All in all, the 33% drop in the price seems to be an overreaction. Even the analysts cutting down their price target still price it 30% higher than the stock's current price. I still own PubMatic and plan to hold it, although I would want to closely watch and see the revenue and profitability grow as the digital ad market recovers in the next few quarters. See you next time!
$BABA jumped ~5% on the day of its earnings report and then lost 5% the day after.
The stock is up ~9% in the last three months but far from the all-time high of $300+ per share. It's been a roller coaster investment as the company has gone through political challenges and economic recession in China. Now, we hear the country is dealing with deflation. Can Alibaba survive and generate significant value for its long-time holders? Let's find out! Interesting Stuff From BABA's Earnings Report
Alibaba released its large language model, which got millions of users.
As a part of the recent reorganization, Alibaba Cloud is moving toward an IPO, and it managed to show a significant 100%+ jump in profitability despite small 4% revenue growth. Alibaba's Revenue
But Alibaba Cloud was up only 4%, putting even a bigger distance between Alibaba and Amazon comparison. It doesn't seem Alibaba has managed to establish an AWS-like business yet. Score: Fair to Good -- as the Chinese economy recovers, Alibaba will benefit from higher demand. Something to watch as word has it that China's economy is going through deflation now. Alibaba's Profitability
The net income adjustments are due to fluctuations in the value of its equity investments in Ant Group and other public companies. Score: Good -- profitability is a focus; the latest results show it. Alibaba's Balance Sheet
~ $81B+ cash & cash equivalent
vs. No significant debt Score: Good Alibaba's Free Cash Flow
~$5.4B in free cash flow
The company has spent $3.1B in share repurchases. This speaks to the free cash flow generation power of the businesses but also indicates BABA is not focused on drastic improvements of its business. Per announced plans, BABA is focused on splitting its business into six separate individual companies. Score: Good -- Free cash flow is a priority. Alibaba's Valuation
P/E of 25X
Forward P/E of 11X PEG ratio of 1 P/S of 2.1X The stock is undervalued compared to its American counterparts, and considering this highly profitable and free cash flow generating operation. But concerns around China's overall economy and China-US. 4elationship, investors aren't willing to pour money into this stock. Score: Good Is Alibaba (BABA) A Buy Now?
Solid fundamentals
Great valuation Need lots of patience to get value. It isn't a straightforward investment as it will gradually split itself into six separate businesses. I own shares. Hold until I need the capital for other priorities. Do your research: https://stockcard.io/BABA
$PUBM dropped ~33% after its earnings report on Wednesday.
What could bring a free cash flow generating company in a slowly recouping advertising market down by more than 30%? Raymond James and Macquarie Analysts cut their price targets to $18 and $16, respectively, still above the current $12.5 price. Is the price drop a chance to buy, or is the company failing its shareholders? Let's find out! Unexpected Stuff In PubMatic's Earnings
One of the company's clients filed for Chapter 11 bankruptcy and owed PubMatic $5.7M. $PUBM had to deduct this amount as a bad debt from its earnings, resulting in a negative 9% GAAP net income margin.
Brand advertisements have started to slow down in June and July, after good March and April. -- overall impression is that the ad market is recovering, but apparently not. PubMatic's Top line
$PUBM uses software to find the best advertising slots and match them with advertisers online, on mobile devices, and connected TV programs.
This Q, revenue was $63M and flat Y/Y. However, there are a few leading indicators of future revenue growth:
Score: Fair -- the leading indicators paint a positive outlook despite flat revenue. PubMatic's Profitability
Score: Fair -- one-time expenses are dragging down profitability this Q, and higher margins are expected due to higher efficiencies created by investment in the infrastructure. Something to watch for! PubMatic's Balance Sheet
~ $100M+ cash & cash equivalent
vs. No significant debt Score: Good PubMatic's Free Cash Flow
Free cash flow, a true indicator of a company's ability to make money, almost doubled compared to Q2 2022.
Score: Good -- Free cash flow is a primary priority for the company, and it shows. PubMatic's Valuation
P/S of 7X!
To reach 7 times sales growth, PUBM requires 20% revenue growth per year in the next ten years. This is feasible if the advertising spend goes back to growth and the company's new product launches should help. Using P/E, the company is quite overpriced, at 60X PE and 100+X Forward P/E. Score: Bad -- watch for revenue growth and the impact of new product launches to justify the valuation. Rule of 200
The last time I looked at the company, it scored well above 200, partially thanks to do solid gross margin and excellent retention rate.
This time, The company didn't share the retention rate! Questionable! Revenue growth + Gross margin + Operating margin + Net retention rate 0% + 60% - 9% + ? Score: Bad -- in the penalty box to see evidence of retention and margin expansion. 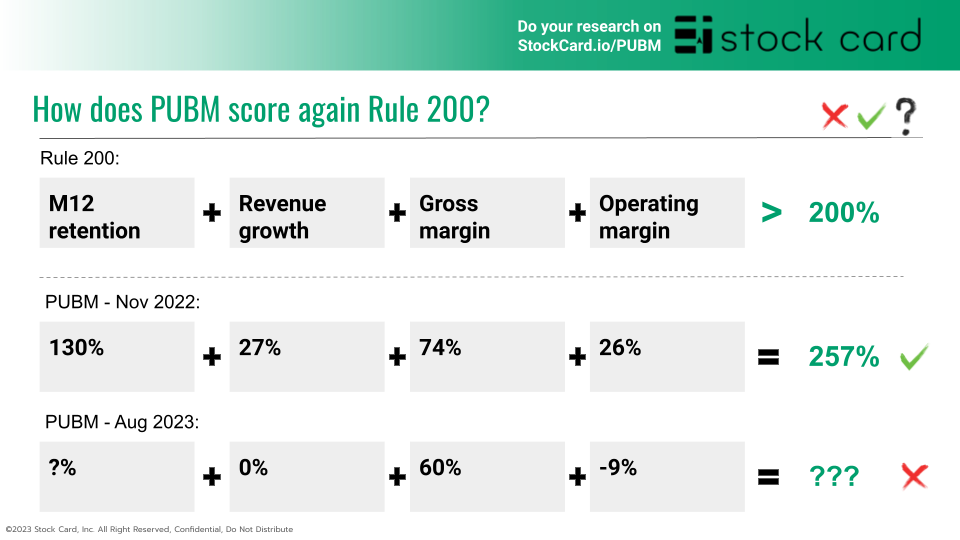
Is PubMatic (PUBM) A Buy Now?
The company's fundamentals are alright, despite the market's softness and excluding one-time expenses.
The stock price isn't cheap, but the valuation can be justified if 1) the market goes back to growth and 2) new products launched start delivering revenue. I own shares and plan to hold them. But the stock is in the penalty box to monitor for significant improvement. Do your own research here: https://stockcard.io/PUBM |
Categories
All
Archives
March 2024
|


 RSS Feed