Master your fundamental research. Join 79,627 investors who trust our platform and content.
Save 54+ hours of fundamental research with free access to Stock Card.
We only ask your name and email address.
|
If you mix these three ingredients:
The real estate sector is killing the banks again! We saw a glimpse of this situation last week. New York Community Bancorp reported a surprise $252 million earnings loss and $552 million in loan losses, a 790% jump in loan losses compared to the previous quarter. In today’s post, I'll explain what's happening with commercial real estate and regional banks. Share interesting investment opportunities, and duscusd two REITs to consider buying now to take advantage of the situation. Let’s talk about them!  I'm Hoda Mehr, founder, and CEO of Stock Card, and on this blog and its accompanying YouTube channel and Podcast show, I share detailed fundamental analyses and interesting investment stories.
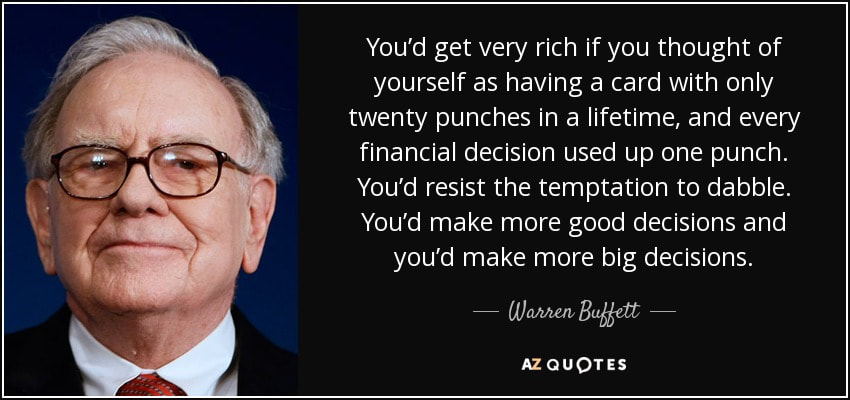
This post is part of our educational series to help you hone your fundamental investing skills. Catch up with past blog posts on How to Invest Like Buffett? How to Invest Like Charlie Munger, or how to Find the Highest-Returning Stocks? Remember, this content is for education and sharing ideas and not advice to buy or sell any securities. Sign up for a free account on Stock Card to get notified of these blog posts, YouTube videos, and Podcast shows every week. We only ask your name and email address when you sign up. What's Happening In the Commercial Real Estate Sector?First, let's discuss what's happening: New York Community Bank stock fell almost 60% in the last few days after Moody's dropped its credit rating to junk. The company also had a miserable quarterly earnings report with surprising earnings loss, loan losses associated with two apartment and office building loans, and a 70% cut of its dividends. It's a perfect storm for one company but a giant signal for the broader regional banking and real estate market. Let's step back and understand the context behind this situation: There are three types of banks based on their asset size in the United States:
Smaller and regional banks specialize in small business lending and local community development. If you are a real estate developer or a property owner, you'll be better served by regional banks. Jill Castilla, CEO of Citizen Bank of Edmond, on the Bloomberg Surveillance show, explains the advantages of regional banks in local markets: These local banks understand the local market better and can better assess the risk associated with a specific property. What Jill explains makes sense. According to Goldman Sachs, 80% of the commercial real estate loans in the U.S. are held by smaller regional banks. Hold that information aside for a few minutes. Now, let's talk about commercial real estate and office buildings. To understand the scale of the market, commercial real estate is a $25.37 trillion market in the U.S. That's ten times bigger than the $2.53 trillion residential market in the U.S. Commercial real estate includes office buildings, hospitals, warehouses, retail stores, manufacturing facilities, large residential buildings, etc. Office buildings are a big part of this market and represent 16% of commercial real estate. Let's hold this second piece of information aside again and discuss the third ingredient: the commercial real estate loan situation. Commercial real estates are rarely bought or developed by paying cash. And here's something very peculiar about these loans that I learned from Howard Marks, co-founder of Oaktree Capital: Nobody ever repays their loan. They just refinance it. Commercial real estate investors typically refinance their loans to get a longer-term or a longer amortization schedule and increase their monthly cash flow. Or if they hold a term loan, and the loan is coming due, they refinance the loan instead of repaying it. $2.8 trillion of commercial loans will come due between 2024 & 2028, and many were issued when the interest rate was low. When they get refinanced, they will face a significantly higher interest rate and monthly payments. The question is, can they afford higher payments? If a developer or an investor owns an office building, it may generate less revenue than before. Due to the work-from-home or hybrid home-office working model post-Covid, they are collecting less rent than before. As a result, chances are they won't be able to afford a higher interest rate for their loans, and they may even default on their loan. Now, let's bring it all together: Regional banks own 80% of commercial real estate loans in the U.S. A giant portion of commercial real estate loans are coming due in the next three to four years. Most of these loans are expected to be refinanced, as is customary in the commercial lending market. No one pays back their loans. They refinance it. On the other hand, office buildings are 17% of the commercial real estate market. The demand for office buildings and, therefore, the associated rent income is lower than it used to be thanks to the work-from-home and hybrid work model after the COVID era. Some properties have lost a significant portion of their value because there isn't enough demand. And with the higher interest rates, the new borrowing cost is much higher than what developers and real estate investors are used to and can afford. These borrowers may be unable to afford higher monthly interest payments, or what they owe may be higher than their property's value. Banks holding such loans may end up with either revenue loss or bad loans that can never be paid back. That has happened with two properties at New York Community Bank recently, causing the stock to lose 60% of its value. I've heard somewhere that banking problems are like cockroaches. There is never only one of them (ugh). It's fair to assume more banks will collapse due to similar bad loans in the next few quarters. How Is The Commercial Real Estate Crisis Different From The Great Financial Crisis?Things get scary when the word "collapse" comes before banks or real estate sectors. The important question is whether more regional bank failures due to commercial real estate challenges will have a broader impact on the economy. The broader risk of regional bank failure is that businesses that depend on these regional banks for funding and growth will lose access to funds and banking. However, there is a reason regional banks are NOT in the so-called too big to fail category. There are more than 4000 regional banks in the U.S.; if a few fail, it won't be a systematic risk to the broader economy. Moreover, these bad commercial loans are not coming due simultaneously, and the problems are easier to anticipate. Just because we are talking about them now means there is an expectation in the overall financial system that some banks would fail. The last point is that not all regional banks are exposed to troubled commercial real estate, specifically office buildings. Jill Castilla explains many regional banks focus on relationship-based banking and have already taken the steps required to avoid disastrous outcomes. Therefore, most regional bank are not at risk. Final note on risk: Before we move to stocks you may consider investing in now to benefit from the regional bank challenges, I want to warn you that there is still a risk to the broader economy due to this commercial real estate and high interest cost. As they say, risk is what's left after you've thought about everything. Today, we thought about possible ways the real estate sector may impact banks and concluded it would be manageable for the broader economy. But there is always the risk of us not seeing other dependencies in the broader economy. Be mindful of the unforeseen risks, always. How To Invest & Benefit From Commercial Real Estate CrisisIf not all regional banks are doomed because they have done a good job at their due diligence, and similarly, if not all commercial real estate and specifically office buildings are in trouble, this means there are investment opportunities for all of us at a reasonable price in the commercial real estate market. Luckily, stock market investors don't need to buy commercial real estate to benefit from the market opportunity. We can find the right fund or a Real Estate Investment Trust (REIT) that is reasonably priced or undervalued. Cathy Marcus, Global Chief Operating Officer of PGIM Real Estate with $208B in assets under management, gives us some clues into such commercial real estate investment opportunities in her conversation with Barry Ritholtz on the Masters of Business show. First, we have many companies that are back to the in-person model. And a bigger portion of companies allow a hybrid model. In both cases, companies use their office quality to attract talent and employees into in-person collaboration. This means only a certain type of office building will be in demand. According to Cathy Marcus, those are Class A buildings with wellness and ESG attributes that have higher quality than employees' houses, encouraging them back into in-person setting. Anything lower than that isn't in demand and has a hard time generating rent income. That means REITs focusing on Class A buildings may offer interesting investment opportunities. I searched for Office REITs on our company's website, stockcard.io, and a few names grabbed my attention: Alexandria Real Estate Equities, ticker ARE, is one good example. It focuses on Class A office buildings in the life sciences sector. According to financial analysts, the stock has more than 13% upside compared to its current price and pays more than 4% in dividends. Boston Properties, ticker BXP, is another one. This REIT focuses on premium, Class A offices in Boston, New York, San Francisco, and Washington DC, with more than 11% upside, according to financial analysts, and 6.2% in dividends. Consider researching those REITs as a part of your portfolio. Talking about good stocks to buy now, last week, I discussed how to find quality stocks at a reasonable price and shared a few stocks to buy now following such an investment methodology. If you missed it, reading it now is good. I'll see you next time! GMO Asset Management is a firm that manages $61B in capital. It’s been actively picking stocks in its GMO Quality Fund for ten years, and it has managed to beat the market in every single year of the last decade with an annualized return of 13.4%, beating the S&P 500 quite nicely. In a world where most stock-pickers either lose money or underperform the overall market, consistently beating the market is rare. The good news is that the team behind this high-quality, active investment fund has just launched an ETF we all can invest in with whatever amount of money we want to. In today’s post, I dig into the fund’s stock-picking strategy that has beaten the market for a decade and give you a list of stocks based on the fund’s market-beating strategy that you can consider buying now. Let’s talk about them!  I'm Hoda Mehr, founder, and CEO of Stock Card, and on this blog and its accompanying YouTube channel and Podcast show, I share detailed fundamental analyses and interesting investment stories.
This post is part of our educational series to help you hone your fundamental investing skills. Catch up with past blog posts on How to Invest Like Buffett? How to Invest Like Charlie Munger, or how to Find the Highest-Returning Stocks? Remember, this content is for education and sharing ideas and not advice to buy or sell any securities. Sign up for a free account on Stock Card to get notified of these blog posts, YouTube videos, and Podcast shows every week. We only ask your name and email address when you sign up. Quality Investing Isn't Value InvestingThe methodology behind GMO’s fantastic return is investing in quality companies at a reasonable price. This may sound familiar to many, but how GMOs define “quality” is very interesting. Also, the ways the fund managers explain “reasonable stock price” is fascinating. When you hear the term reasonable price, it's natural to think of undervalued stocks with low multiples, such as low price-to-earnings ratio or low price-to-book value ratio. GMO’s partner, Tom Hancock, explains the difference between quality and low-value stocks with a perfect analogy: Quality and value investing are very different approaches. Quality doesn’t always mean paying a low price and picking a low price to earn earnings or price book value multiples. Quality investing is like when you buy a bit more expensive house in a good neighborhood with good schools around and can sell the house at a great return a few years down the road, vs. buying a cheap condo in a not-so-good neighborhood, hoping for an up-an-coming investment opportunity which doesn't happen as fast as you had hoped. An even more insightful thing I learned when researching this investment strategy is that investing in quality defies all the commonly accepted logic about risk and return. Everybody says higher return requires higher risk. In practice, investing in high-quality businesses leads to less risk in the form of less price fall during a downturn and several sustained years of generating better-than-market returns. This becomes quite clear when we define risk as the probability of a permanent loss of capital. With that definition of risk, investing in high-quality companies has less risk because the business isn’t as prone to market noise and macroeconomic cycles. What's A High-Quality Stock?Quality is the ability to deliver high return on capital. To deliver that you have to have something competitors can’t replicate. It used to be a physical asset or brand. In the tech era, it is network effect or platform companies. Management quality is also a part of the company’s overall quality. Good management keeps the balance sheet strong to create stability across economic cycles and allocates money when required. The good news for stock-pickers who want to focus on quality companies is that they tend to stay high quality for a long time. Therefore, you don’t have to recognize them right off the bat. You can be wrong early on and ignore the stock; when you see the evidence, you can turn 180 degrees, admit it, and invest in it. For example Apple is a quality company and both GMO and Warren Buffett were late to Apple’s quality party and their eventual investment still did great. Even though Warren Buffett didn't invest in Apple’s IPO or the dot com crash. Still, it turned out to be one of its best investments ever. How To Find Quality StocksThere are two ways to find quality stocks based on GMO's definition of quality we just discussed:
In the rest of the post, I’ll use both methodologies to find quality stocks at a reasonable price that you may want to invest in after doing your own research, of course. First, let’s discuss the financial metrics we can use to find quality stocks. Tom Hancock gave a few such metrics in my research. Let me summarize them for you:
I plugged these criteria into Stock Card’s stock screener tool, and I got about 100 stocks that turned in the screener results. Here's the link to this screener if you want to download the list or adjust the screener. But think about it! Of thousands of stocks listed in the US, only 100 meet the criteria. Also, because we are using return on capital, return on asset, and similar return ratios in the screener, there are a lot of bank stocks showing up in the results. I tend to put them aside. Without bank stocks, you’ll end up with an even smaller number of stocks that meet the criteria. Some interesting companies that attracted my eye are Alphabet, Applied Materials, and Dropbox. QLTY ETF's Top HoldingsNow, let’s turn to the second approach of finding high-quality stocks at reasonable prices by looking at the top holdings of GMO’s new quality ETF. The ETF’s ticker is QLTY, which is very well-named. Because the ETF is less than a year old, it’s fair to assume stocks picked for the ETFs are still truly representative of GMO’s reasonable price picks. On the list, I see some of the usual quality stocks such as Alphabet, Apple, and Meta. I also see some names that i wouldn’t have normally paid any attention to me. Otis, ticker OTIS, the big leader in elevators, escalators, and moving walkways, is one example. Elevance Health, ticker ELV, is another one I have not heard much about. TJ Maxx, ticker TJX, would be my third pick to research just because I have always wanted to look into it but never did. You notice that stocks such as NVIDIA weren’t in the top holdings of the ETF. NVDA is definitely a high-quality company but may not be reasonably priced even if it is the undisputed kind of AI semiconductor market. Talking about high-quality stocks tending to be low-risk stock picks, a post I published recently explained what risk means and how you can calculate your portfolio’s risk. That’s a good one to read to next. I’ll see you next time! You've most likely heard of diversification and rebalancing as good ways to reduce risk in your portfolio. But some of the best investors in the world don't agree with those. Warren Buffett is against diversification and calls it a protection against ignorance. However, prominent investors such as Ray Dalio and most financial advisors advocate diversification and similar risk management strategies. The reason for these opinion differences is that risk is defined differently by different investors. In today's post, I want to introduce you to the real definition of risk and give you a practical approach to reducing it regardless of whether you are in camp Warren or agree with Ray Dalio and most financial advisors.  I'm Hoda Mehr, founder, and CEO of Stock Card, and on this blog and its accompanying YouTube channel and Podcast show, I share detailed fundamental analyses and interesting investment stories.
This post is part of our educational series to help you hone your fundamental investing skills. Catch up with past blog posts on How to Invest Like Buffett? How to Invest Like Charlie Munger, or how to Find the Highest-Returning Stocks? Remember, this content is for education and sharing ideas and not advice to buy or sell any securities. Sign up for a free account on Stock Card to get notified of these blog posts, YouTube videos, and Podcast shows every week. We only ask your name and email address when you sign up. What's Portfolio RiskCommonly, stock market investors assume risk is equal to volatility. For example, if a stock goes up and down more than the overall market, it is considered risky. There is a technical term for it, too. It's called Beta. A stock with a beta above one is deemed more risky, a beta of one means a similar risk as the overall market, and a beta under 1 means a stock is less volatile than the overall market. Again, commonly, to address the volatility, the prescription is to diversify your portfolio across multiple sectors and geographies and rebalance your portfolio regularly to avoid a few winners taking a significant portion of it. But Beta isn't really equal to risk. By definition, risk is a situation where you are in danger. What's the danger in the stock market? Losing your money. When a stock goes up and down significantly, it doesn't mean you will lose your money. In particular, you are not in danger when you understand why a stock moves and don't sell the loser just because the price has gone down. A stock price may go down even if there is no problem with the company's fundamentals due to an overreaction to the news or macro factors. It's also possible that there is a real problem with the company's revenue or profit. The first scenario is not dangerous, the second one could be. Very successful investors such as Howard Marks, billionaire investor and co-founder of Oaktree Capital define risks as the probability of permanent loss of capital. It means you take more risk in your portfolio if stocks the stocks you own have a higher probability of going down to zero, not because they are volatile. For example, I told you earlier that investors commonly use a technical indicator called Beta to measure risk. Amazon's Beta is 1.56. By definition, this means investing in Amazon's stock is riskier than the overall market. But, it is impossible to assume you will be in danger of permanently losing your money if you invest in Amazon even though it fluctuates more than the overall market. I'm not saying there is no risk in investing in Amazon. However, as long as Amazon has a growing eCommerce, cloud services, and advertising business, and you invest in it at a reasonable price, the risk of losing your money is not higher than the overall market. The risk in investing in Amazon comes from your behavior. If you panic and sell when Amazon's stock price goes down, if you don't keep up with Amazon's business and don't understand how it makes money, those are the real risks. Real Sources of Portfolio RisksTaking it back to your portfolio and using the new definition of risk as the probability of permanent loss of capital, how do you reduce risk? You look for companies that have a higher probability of falling apart. Here are a few reasons for a higher likelihood of big losses:
I'm not saying you shouldn't invest in those companies. However, if more than 50% of the holdings in your portfolio have one or all of the six factors I just listed, you are taking a real risk of permanently losing your money. How to Identify Hidden Risks In Your PortfolioTo apply this step, go back to your portfolio, review each individual holding, and put an X in front of it for each of the six factors we just discussed. Count how many holdings have at least one X in front of it, and divide it by the total number of stocks in your portfolio. The result shows a rough likelihood of you losing your money. Are you comfortable with that number? If not, in 2024, your task is to replace those companies with other companies that have lower real risk. It requires some time to research each stock, but the effort is worth it. You may also be comfortable with the probability of losing money. This is a very personal decision and goes back to your financial situation. The number itself doesn't matter. But it matters that you are comfortable with it. If you watched to this point, I know you are already committed to leveling up your investing skills and developing your best portfolio. The good news is that we launched a coaching program to help assessing the risks in your current portfolio and setting up the foundation for the best portfolio you can create. Visit the course page to learn more and sign up. I'll see you next time! NEW COURSE IN 2024 |
Categories
All
Archives
March 2024
|

 RSS Feed