Master your fundamental research. Join 79,627 investors who trust our platform and content.
Save 54+ hours of fundamental research with free access to Stock Card.
We only ask your name and email address.
|
There is a rule in investing and portfolio management that every investor should learn on day 1: Rule 72.
If you make an average 3% return annually in the stock market, doubling your money takes about 24 years. You get the 24 years by dividing 72 by 3%. The 3% return is the average annual return of retail investors like you and me, according to many studies that have calculated the average return of retail investors over several decades. Ouch! 3%, 24 years! But 24 years is too long! How can you double your money faster than the other individual investors? Today, I will share three ways to double your portfolio FASTER than the market average. Let's talk about that! 
I'm Hoda Mehr, founder, and CEO of Stock Card, and on this blog and its accompanying YouTube channel and Podcast show, I share detailed fundamental analyses and interesting investment stories.
This post is part of our educational series to help you hone your fundamental investing skills. Catch up with the other post on How to Invest Like Buffett? or how to Find the Highest-Returning Stocks? Remember, this content is for education and sharing ideas and not advice to buy or sell any securities. Sign up for a free account on Stock Card to get notified of these blog posts, YouTube videos, and Podcast shows every week. We only ask your name and email address when you sign up.
Let's talk about three ways you can double your money faster. Before we even start the video, I give you one strategy you can adopt today and reduce your time to double the money from 24 years to 7. Invest all of your money in the S&P500 Index ETF, ticker SPY. This ETF has returned an average of 10% in the last 30 years. 72 divided by 10 is about 7 years.
But if 7 years is still too long, watch the rest of the post. Logically, you need to generate higher returns to double your investment faster. That's simple to understand. If you generate higher returns, you'll move faster. But how do you increase your rate of return without gambling? That's the question. I can take my $100 to Vegas tomorrow, put it on the blackjack table, and try to double it in 5 minutes. Many investors try to achieve such returns by investing in crazy, highly volatile stocks, IPOs, and things like that. Those are possible ways to go about it, but they require lady luck to be with you, and many of us don't have the stomach to put our portfolio at risk and in the hands of the game of chance. We want to discuss logical and practical ways we can implement quickly to double our portfolios faster. I've found three strategies we can follow to achieve that goal, and implementing each strategy doesn't take too long, and anyone, even beginners, can do it. You adjust your portfolio once and sit back to see the results. I ordered the strategies from the most to the least common approaches. So, as we talk about the strategies, it gets more interesting. The first strategy: Invest more frequently
Investing as soon as possible and frequently as possible is one of the best ways to double your portfolio faster. This is because investing sooner gives you more time in the market, and investing more frequently allows you to take advantage of the market's downtrend and lower prices, resulting in higher returns in the same time period.
Most people don't do that because they want to find the lowest market prices. It's logical, but in practice, it's almost impossible to figure out when the prices are at their lowest in the stock market. If you invest frequently without trying to find the so-called market bottom, inevitably, you'll catch the market's bottom and invest at the lowest prices. I've seen this in our users' portfolios on Stock Card. In an attempt to find the market bottom, most investors wait too long, and the market goes back up before they take any action. Here's a real example. Let's say, 2 years ago, in September 2021, when the market got too expensive, you decided to monitor the S&P500 ETF price with the aim of finding the market's bottom. In fact, many of our users on Stock Card have stopped researching new stocks and ETFs about that time, and when we asked why, they said they were waiting for the bottom. If you were one of them, you could have waited until April 2022, and the price would have dropped by 10%. This could have been the bottom, and you could have invested your money. The problem is that even though the market went up slightly after that, had you waited a few more months, by September 2022, the ETF's price was down another 13%. In reality, none of us can predict the exact bottom, and in an attempt to find the bottom, we either jump in too soon or stay away too long, missing the market's best days by waiting for a bigger drop. Instead, you would have been in a much better position had you invested your $100 slowly and a small amount every month between then and now and caught the market bottom automatically by the nature of your frequent investments. This strategy is called dollar cost averaging and results in a smoother, less volatile, effortless strategy that can also improve your rate of return, especially if you are one of those investors who tend to stay away from the market far too long. Because of its effortlessness, it's ideal for beginner investors, too. The second strategy: Take more calculated risks
Another way to double your portfolio faster is to take more risks but calculated ones. This means investing in assets that have the potential to generate higher returns, even if they come with more risk. But the risk is calculated, and you still manage your risk by eliminating easy-to-see sources of risk.
Rule 72 tells us that if our return is 10%, we need about 7 years to double our money. A 10% return is what most investors expect from investing in low-risk, broad market indices before any fees and costs based on historical data. What if we get a 1% higher? 72 divided by 11% equals 6.5 years required to double our money. How about a 15% annual return? The time to double our money is cut to 4.5 years. Which assets have a higher annualized return than the broad market index ETF? Riskier assets such as small-cap stocks or international emerging countries and specific high-growth sectors such as biotech or technology can give you a higher return than the market's average 10%. For example, Vanguard S&P Small-Cap 600 ETF, ticker VIOO, has had roughly 12% annualized return since its inception over 13 years ago vs. the 9.94% annualized return of S&P 500 ETF, ticker SPY. Similarly, VanEck Biotech ETF, ticker BBH, has had a 14.33% annualized return since its inception 12 years ago. The problem with these investments is that they are also more volatile. Looking at their recent performance, many small-cap or specialized ETFs have underperformed the overall market recently. You can easily get caught up in a down cycle, and your return gets even smaller than the market index in the short term. But what did we discuss in Strategy One just a minute ago? Invest slowly and frequently as the prices go down, resulting in higher overall returns. These strategies are all interconnected.
The third strategy: Develop EMOTIONAL control
Improving your emotional control is typically advice from your school counselor or marriage therapist. I'm not either of those. But controlling your fear and anger in response to the market's ups and downs is the most important skill you can develop, allowing you to double your money faster.
Let's talk about a very practical example. We all know the rule number of one of investing. Buy LOW, Sell HIGH. Look at your own behavior now. How many investments have you made in the last 12 months when the market is relatively lower than the all-time highs of the COVID rally in 2020 and 2021? BE honest! Were you buying things when they were high, hoping to sell higher? And have you stopped investing now because you are scared the prices are down? What happened to the old wisdom of Buy Low, Sell High? Looking at the retail investors' trading volume when the stock market goes down confirms that we all make the mistake of doing precisely the opposite of buying LOW and selling HIGH. During COVID's market rally, retail investors' trade volume was going up, and as soon as the market got a bit cheaper, the volume died down. Fear of losing more money and being scared when the market is down is a natural human reaction. But it's the enemy of your portfolio. Peter Lynch puts it the best: "In Investing Your Stomach Is More Important Than Your Brain"
In the $100 example I gave earlier, we discussed how investing slowly and steadily instead of trying to find the bottom can improve your return. In the same example, if you could control your emotions and invest MORE whenever the stock market drops by 10% or more, let's say in April 2021 and June 2022, you could have increased your investment return significantly. The more the market is down, buy more. This is NOT to say that you must wait for a market dip. This means you can increase your return if you increase your investment when the market is down, contrary to the emotional reaction our brains may have in such situations.
Dan Ariely, professor of Behavioral Economics at Duke University, gives one practical exercise that can help you strengthen your emotional control in investing. He advises investors to invest looking forward and assume they have no portfolio: Make investment decisions regardless of what happened to your portfolio. This means don't look at your portfolio when you want to invest. Don't ask yourself what I do now that my portfolio is down 20%. Assume you have no portfolio so the anger and pain of losing money don't cloud your judgment. Do your research looking forward, not based on what you have lost.
Today, we discussed three ways you can double your portfolio faster:
I'll see you next time!
Picture this: You go to YouTube, look up your favorite YouTuber, and he gives you one or two stock picks to feel excited about. Before you close the app, YouTube recommends another video titled "Best Stock Picks This Year," you watch it, adding a few more stock picks to your list. You promise yourself you come back and research them next weekend. But before you go to bed, a quick scroll through Twitter adds a few more ideas to your list, and just about the time you think you can't handle any more stock ideas, a breaking news article on CNBC adds a new ticker to the top. At best, you research a few haphazardly and skip the rest, and at worst, you forget about the list and repeat the same process the next day.
This stock-picking dance happens to all of us more often than we care to admit it. It is quite damaging to our success as long-term investors. In today's blog post, I'll share a process that can help you take control of your stock-picking process. It's simple and effective; anyone can use it, and it puts you in control and it is based on how Warren Buffett recommends you pick stocks. Let's talk about that! 
I'm Hoda Mehr, founder, and CEO of Stock Card, and on this blog and its accompanying YouTube channel and Podcast show, I share detailed fundamental analyses and interesting investment stories.
This post is part of our educational series to help you hone your fundamental investing skills. Catch up with the other post on How to Invest Like Buffett ?. Remember, this content is for education and sharing ideas and not advice to buy or sell any securities. Sign up for a free account on Stock Card to get notified of these blog posts, YouTube videos, and Podcast shows every week. We only ask your name and email address when you sign up.
The starting point of this template is how Warren Buffett recommends you pick stocks. After we understand how he does it, I'd share a more practical and useful template you can use to find stock picks according to his methodology but in the modern day and age.
Warren Buffett's Approach: On several occasions, investors have asked what he would do if he had a small amount of money and wanted to make lots of money in the stock market. His answer has two parts:
To pick stocks following Buffett's suggestion, I have devised a framework I call a three-legged stool with a flower vase. Market Cap Filter
This typically refers to a company with a market cap of at least $50 Million or above but lower than $10B. Chris Myer, the author of the 100-bagger book, explains this best. Chris has looked through companies created more than 100 times in return between 1962 and 2014 and found the most common characteristics of such companies. The idea is that smaller companies can grow ten or 20 times, still be small, and have room to grow over the year. In contrast, Apple today has a roughly $1Trillion market cap. We can safely assume it won’t go up 10 or 20 times and certainly not a hundredfold. So for us long-term investors buying companies to hold for 3, 5, or 10 years and, in return, expect to get rewarded significantly, we have to focus on smaller companies.
How to find them? It's one of the easiest criteria to screen for. You go to Stock Card's stock screener tool, and choose the market cap filter, and remove companies with less than $50M and more than $10B in market cap. Please notice this would exclude very good investments such as Airbnb or Nvidia. But, notice, here we are focusing on finding companies that don't trend, and also, we are looking for companies that truly deserve to be held for a decade. Nvidia is a great company, but we all have exposure to Nvidia, either through holding broad market indexes such as SPY or some other ETFs. Revenue Growth Filter
We've often heard that fundamental investing is picking businesses, not stocks. This means we must have a few criteria to differentiate a good company from a crappy one. If there is only one filter we should pay attention to, we should focus on revenue growth or a company's ability to grow revenue. Without revenue growth, it is very hard to attract talent and capital, and the company starts to shrink and decline, especially if the plan is to hold the stock for 3, 5, or 10 years, this criteria becomes super important.
How to find them? One simple way to look at it is to just look at companies who grow their revenue in the last 12 months. But businesses are like humans, they have good years and bad. You can't just judge them based on one year's performance. You want a company that has been able to grow most of the time, with some flexibility for slower growth in a quarter or two. I prefer looking at the company's annualized revenue growth in a 3-year. On Stock Card's screener, if you choose the "Solid Revenue Growth" filter, it is based on the company's revenue growth in the last quarter over quarter, year over year, and 3-year period. Looking at all three periods, Stock Card allows for flexibility in revenue growth interruptions if a company has a bad quarter. Cash Generation Filter
What's the most important reason businesses exist? I wait a few seconds for you to think about this. If you said making money, you are spot on. Yes, businesses exist to make the world a better place, innovate to solve problems, bring a dream to reality, and so on, but at the end of the day, the ultimate goal of any business is to make money.
How to find them? We can use net income or profit that companies report at the end of the profit and loss statement. However, net profit results from accounting rules that don't always show the company's cash generation power. Instead, free cash flow is a better indicator of a company's ability to generate cash because it excludes non-cash expenses such as stock-based compensation and includes cash expenditure on capital expenditures. It shows the true power of a company in making money. On Stock Card's screener, if you choose the "Cash Availability" filter, it is based on the company's free cash flow and its growth in the last quarter over quarter, year over year, and 3-year period. Looking at all three periods, Stock Card allows you to filter out companies that aren't truly cash-generating.
Those three filters are foundational to your long-term stock screening. However, they are not the only screeners you have to use, but it take the universe of more than 21K stocks listed in the U.S. down to around twelve hundred stocks on the day of recording this session for you.
Now, for the next part of our discussion, let's focus on how you can further narrow down the list from 12 hundred stocks to a few. If it were young Warren Buffett, he would have started researching the full list. But let's accept that with the help of technology, we can be much more efficient than Buffett. Two Additional Filters To Screen Stocks Like Buffett
First off, there are super easy ways to cut things out.
Now, we have a screener that gives us about 100 stocks or so that are worth researching and spending time on. It is very easy to take this screener and make it more personal to your investment strategies. For example, if you want a company to be profitable or rather invest in undervalued stocks, those are additional criteria you can add. This is the link to the screener I created in this blog post: Click Here. You can save it to your Stock Card account and adjust it to your liking, if you are on the mission to invest like Buffett! I'll see you next time! The world is changing! Fitch Ratings downgraded the United States' creditworthiness from triple-A to double-A. The US was once the absolute economic power in the world, and the U.S. dollar was the most desired currency globally; maybe it still is, but cracks are appearing in this fortress. The U.S. could have borrowed money from anyone, and there was never even a sliver of doubt that the country couldn't pay it back. But, credit agencies like Fitch have started to paint a new picture by downgrading the country's creditworthiness. This seems like a disaster for stock market investors who are used to seeing financial analysts downgrading a stock, resulting in price drops and drama in the market. It's only natural to assume getting downgraded is a disaster for the U.S. The media certainly make it seems to be a big deal. But is this downgrade really that bad? Is it a sign of the change in the world economic order? And if so, what are its implications for individual investors and their portfolios? Let's talk about that.  I'm Hoda Mehr, founder, and CEO of Stock Card, and on this blog and its accompanying YouTube channel and Podcast show, I share detailed fundamental analyses and interesting investment stories.
This post is part of a series I started a few weeks ago to fundamentally research companies to manage my real-money portfolio. I've already researched Canopy Growth (CGC), Fastly (FSLY), Snap (SNAP) , Shopify (SHOP), Airbnb (ABNB), Unity (U), JD.com (JD), NVIDIA (NVDA) and several others. I also started sharing interesting investing-related stories. The first one was on what happens when the U.S. hit its 2% inflation target. More interesting stories are in the works. Remember, this content is for education and sharing ideas and not advice to buy or sell any securities. Sign up for a free account on Stock Card to get notified of these blog posts, YouTube videos, and Podcast shows every week. We only ask your name and email address when you sign up. Most of you already heard of the Fitch Ratings downgrade of the U.S. But it is not the only credit rating agency that downgraded the U.S. The S&P rating agency downgraded the U.S. back in 2011. Three big rating agencies in the world rate the creditworthiness of entities such as companies and governments – Moody's Investors Service, S&P, and Fitch Ratings. These three have a 95% global share in the rating market. The recent downgrade hasn't also come out of the blue. Fitch Ratings has had the U.S. on creditworthiness watch from time to time and has issued a negative outlook in 2011, 2013, 2019, 2020, and earlier in 2023, before the actual downgrade. The prominent reason for all these downgrade warnings and creditworthiness watches has been the consistent rise in the U.S. debt in relation to the country's GDP and the political standoff and uncertainties in raising the debt ceiling. Are Credit Agencies Right?In logical terms, when someone's creditworthiness goes down, it's because there is a higher chance that the person will not be able to make the debt payments. Is there a higher chance for the U.S. not to be able to repay its debt? It all starts with the government's budgeting process. When the revenue it earns from taxes is insufficient to cover all its expenses on health care, defense, etc., it must borrow money. Typically, the U.S. sell bonds to its citizens and the rest of the world to borrow this money. We know these bonds as Treasuries. As we all know, the U.S. has been borrowing more money year after year, and it keeps hitting the allowed amount of debt and has to increase it through an approval process. If the government doesn't get approval, it won't be able to pay for its expenses, including paying the interest on all the borrowed money over the years. This gets even more critical when the interest rate is going up. The higher the interest rate the government pays to other countries to borrow money from them, the higher the debt repayment cost, which then requires the government to go through the process of raising the debt ceiling again. This is where Fitch Ratings insert a concern. It references the political stand-off and resorting to last-minute decisions to increase the debt ceiling as a risk. It's, in a way, true. If these uncertainties around the ability to pay interest scare borrowers from around the world and result in them not wanting to lend money to the U.S. anymore, then, it means the U.S. has lower creditworthiness. Is the U.S. Creditworthiness Really Lower?
In a way, the downgrade doesn't really matter at this point because no one believes that the U.S. will stop paying its debt, and everyone wants the high yield the U.S. debt generates. We must discuss one real long-term threat to the U.S.'s global creditworthiness. What's The Real Threat of Fitch's DowngradeOne of the reasons everyone in the world wants to hold the U.S.'s debt is that it's the world's reserve currency. We hear that all the time. Central banks and major financial institutions hold U.S. dollars for international transactions. When you hold U.S. debt, you get paid interest in dollars, and that's what people want. They want to get paid in U.S. dollars. The long-term threat can be that people won't want and need to hold as much U.S. dollar anymore. That's possible when there is an alternative currency that the central banks would also want to hold. Every few years, we see an attempt by global players to reduce the U.S. dollar's status as a reserve currency. For example, at the peak of cryptocurrency interest, there was a discussion that central banks hold Bitcoin as a reserve currency. Recently, there is been talks that China, India, and Russia are settling oil purchases in non-dollar denominations. These things happen because other countries want to lead the world or at least share the power with the U.S. And every little thing that reduces the U.S. leadership can make a difference in the long run. A man can only lead when others accept him as a leader. For the U.S., it can only lead the world until others accept it as one. The downgrade in 2011 by S&P didn't have a major impact then, but it gave Fitch the courage to downgrade the U.S. in 2023. One small chipping at the wall of the U.S. creditworthiness can gradually erode the fortress. So the Fitch downgrade should be a wake-up call to the U.S. to get its act together. Let's wrap up by talking about the impact on our individual portfolios. The Credit Downgrade's Impact on the MarketWhen S&P downgraded the U.S. in 2011, the stock market dropped five to seven percent on the same day. The same happened when Fitch's rating came out on Aug 1st. After the 2011 downgrade, as we know, the U.S. stock market went on several years of upward rally, and nothing really changed because of the downgrade. The same will most likely happen after the Fitch Ratings' downgrade. So there won't be an immediate impact on our portfolios. But, remember, no one can predict the market's direction, especially the macroeconomic indicators at such a scale as the world's reaction to the U.S.'s creditworthiness downgrade. I can publish this episode, and despite all our logical arguments, we may have the biggest drop in the stock market the next day that the market opens. You have to always hedge against such risks. How To Protect Your Portfolio Against the Downgrade's RiskThere are complicated ways that sophisticated professional investors do this. For example, we heard Bill Ackmen, the famous hedge fund manager, explaining his strategy of shorting 30-year U.S. treasuries by buying options. His decision wasn't just due to the downgrade, but he made the Fitch downgrade as one of the reasons to support his decision. There are other and simpler ways to hedge against big macro factors for individual investors. The easiest way is to invest in countries besides the U.S., especially for those long-term investment accounts. For example, in my 401K account, I allocate 60% to the U.S. overall index fund and 40% to the rest of the world index fund. You may want to consider some sort of hedge in your own long-term investments too. See you next time!
Jerome Powell and his colleagues at the Federal Reserve have a North Star – a 2% target for the U.S. inflation rate. I mean, it's more than a North Star. It's their religion, their obsession, their reason for living. They do everything possible to reach the 2% target inflation rate. The U.S. Federal Reserve isn't the only bank in love with the 2% target inflation rate. Canada, Australia, Japan, Sweden, Colombia, and Israel are other economies after the 2% target. It seems so much the global economy, daily news, conversation on social media, and everyday investors' decisions are based on or about this elusive 2% inflation target. What's so magical about a 2% inflation rate? Who says a 2% target is right, and what happens when we finally reach the 2% target? What do we, the individual investors, should know about the inflation target? Let's talk about that!  I'm Hoda Mehr, founder, and CEO of Stock Card, and on this blog and its accompanying YouTube channel and Podcast show, I share detailed fundamental analyses and interesting investment stories.
This post is part of a series I started a few weeks ago to fundamentally research companies to manage my real-money portfolio. I've already researched Canopy Growth (CGC), Fastly (FSLY), Snap (SNAP) , Shopify (SHOP), Airbnb (ABNB), Unity (U), JD.com (JD), NVIDIA (NVDA) and several others. I'll continue with this series for a few more weeks. Remember, this content is for education and sharing ideas and not advice to buy or sell any securities. Sign up for a free account on Stock Card to get notified of these blog posts, YouTube videos, and Podcast shows every week. We only ask your name and email address when you sign up. As an investor, fintech founder, and economist by training, I'm fascinated by the 2% inflation target and all the action it brings to the stock market. The story of where the target comes from and its presumably magical power is worth our attention. From outside the Federal Reserve and in the media and the minds of the good citizens of the nation, we assume the 2% inflation target results from sophisticated financial modeling and years of experimentation by economists and statisticians over the optimal level that oils the wheels of the economy. That seems to be the right way of coming up with an important target for the world's largest economic power. But, if you dig further, the 2% target is apparently a historical accident. Chairman Volcker Had No Inflation TargetWe've heard Chairmen Jerome Powell referencing Chairman Volcker's heroic efforts in combatting inflation and bringing the inflation rate back under control. In the 1970s, inflation was rampant in the U.S. When Chairman Volcker took over the Federal Reserve in 1979, inflation was 11% and still rising. He raised the interest rates to almost 20% to control it, causing sky-high unemployment and two back-to-back recessions in 1980 for six months and in 1981 & 1982 for more than a year. By early 1983, inflation retreated to just over 3%. Notice that the inflation wasn't 2% when the Fed felt it had managed to control it, and neither was it at the 2% level by the time Chairman Volcker left the Fed in 1987. Indeed, our hero, Fed Chair Volcker, never looked for, targeted, or achieved a 2% inflation rate. There was no specific inflation target for much of the economic history globally. The federal reserves of the world all aim to reach price stability. Until New Zealand came up with a fixed target, no other economy was focused on reaching a set inflation rate. New Zealand Created The Fixed Inflation TargetNew Zealand was the first country to come up with a fixed target in 1989. Canada, the UK, Sweden, and other nations picked up the fixed target regime in the years to follow. You'd think the New Zealand government had a good reason and study done to create a fixed target. Alas, the fixed target was born out of a television interview. In the 1980s, New Zealand was battling a high 15% inflation rate and had managed to bring it down to 10% by 1988. The country's finance minister, Roger Douglas, was pressed during a television interview, and he mentioned that he ideally wants to get to a zero to 1 percent target. After the television interview, The Reserve Bank of New Zealand felt it must put some credibility behind the minister's words on TV and use the opportunity to come up with a more concrete inflation-fighting plan. Their economists did some basic calculations to factor the difficulty of accurately measuring the inflation rate and introduced an official 2% target to its economy and a fixed inflation target system to the world. I couldn't make up a more ridiculous story for the origin of a global move toward a fixed inflation target than what the world's economists, finance ministers, and central banks have come up with themselves. Where Did U.S.'s 2% Inflation Target Came From?Back in the U.S., we know there was no specific target when Volcker left the Fed. If it wasn't Volcker, who did all the scientific work to come up with a 2% target? When Alen Greenspan took over Volcker, he commissioned Fed economists to devise a target. At last, someone wanted to do it in the right way. But, sadly, the economist charged with the task came back and said the project would be a huge computer simulation study and requires putting the U.S. through another recession so they could test the sensitivity of inflation to various interest rate levels. Of course, no Fed Chairman wants to be blamed for intentionally creating a recession, so the study was put on the back burner. If the economist didn't do the study, where did the 2% target in the U.S. come from? According to the transcript of an FOMC meeting in 1996, Chairman Greenspan, a Fed Official named Janet Yellen (yes, the same Janet, the Treasury Secretary now), and other officials were discussing a target. Greenspan wanted to reach some level of price stability where price increases don't impact businesses' and households' decisions. Yellen insisted on putting a number on that stable price level. They discussed that measuring inflation accurately is hard, but moving toward a 2% inflation target seemed good, and they will get a sense of the economy as things pan out. Oh, and Volia, my fellow investors, the U.S.'s 2% target was born. Initially, the 2% target was a more like a yardstick for the Fed until 2012, when Chairman Bernanke officially announced it as our nation's inflation target. This is not to say that Chairman Greenspan, Janet Yellen, and other Fed officials and economists didn't know the implication of putting an arbitrary target for the inflation rate. It speaks more about the complexity and the distance between economic theories and the real world. That makes you wonder why all the fuss about the 2% target and why the Fed is still trying to reach the 2% target if it is a made-up number without concrete evidence that reaching it will have the desired effect on the economy. I want to wrap up by imagining the day we hit the 2% target and see what would happen then. What magical chest of gems will we open when we get there? What Happens When We Hit 2% InflationThe short answer is that Nothing will happen when we hit the 2% inflation rate. This is not a password to some sort of economic growth that suddenly gets unlocked at 2%. The long answer is that in an ideal situation, when we hit the 2% inflation rate, there will be a psychological effect. Managing inflation is all about signaling to the consumers that they can save and buy without worrying about losing their purchasing power in the future and to the businesses that they can invest in producing their goods and services and benefit from reasonable growth in the future. It is a sublet psychological balance when consumers and businesses feel "good" about today and the future. So, it isn't the 2% itself that matter, it's the implication of hitting that target that matters most. The two percent level seems to be some sort of a sweet spot. Hitting a two percent level is low enough for consumers' mindset but relaxed enough for the economy to grow. It is also possible that we never actually hit the 2% sharp. For years, inflation hovered above and below the 2% target, and the Fed focused on the average 2% target instead of hitting the actual 2%. In other words, in an ideal world, once we hit the 2% rate, or somewhere in its vicinity, the topic of the inflation rate will drop out of the public's immediate attention, and no one will worry about it anymore. Not worrying about inflation is the best outcome we can hope for when we hit the target. I'll see you next time!
I have been reading on SVB to figure out what happened and why? It's important to me for two reasons: 1) I'm an investor (not in SIVB). Always be learning! 2) I'm a customer (of SVB), which directly impacts us (not critical). Let's dive in! 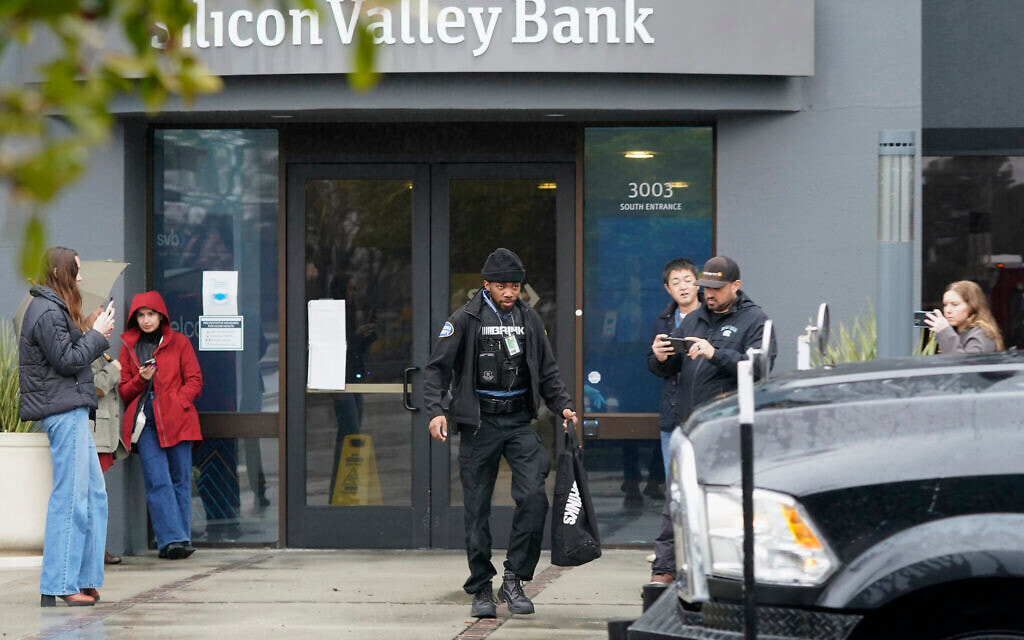 Interest Rates (Part I)SVB had a bunch of bonds. Those bonds' values declined as the interest rate went up. That's just what bonds do. SVB could have held the bonds and gotten paid the coupon value at maturity. But instead, SVB sold tons of bonds at a loss! WHY? RevenueLook at the last earnings results slide (attached). Does it look like a company that goes out of biz in 2 days?
So why did it sell tons of bonds at a loss and raise money? 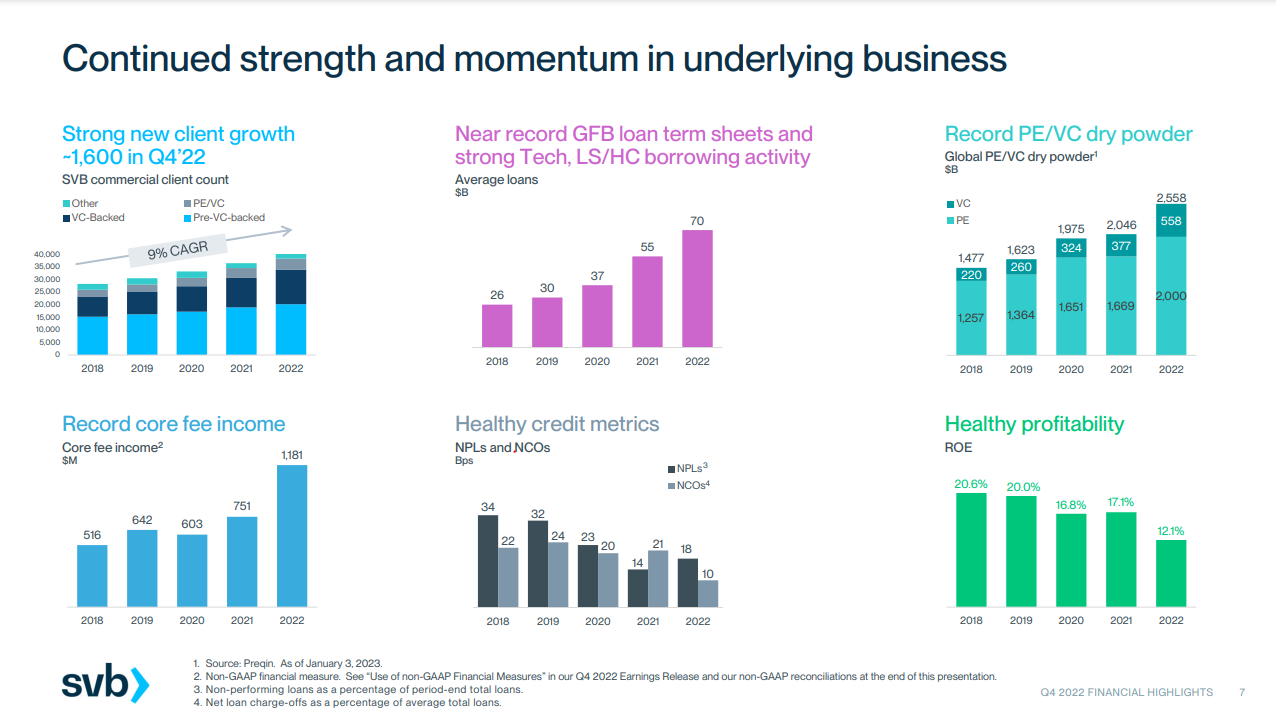
Interest Rates (Part II)You need to know that lots of the banks' customers started moving their cash to interest-bearing accounts, which means higher costs for SVB. According to SVB, each % point decrease in non-interest-bearing deposits would reduce its net interest income by $3M. In summary:
Didn't SVB have cash on the balance sheet? Balance SheetThe company targeted $7-$11B in cash. GOOD
It also had $117B Corp bonds, T Bills, Municipal bonds: GOOD Really, Good? If you have $117B in securities, why do you need to raise $2.2B, which started the SVB collapse this week? Embrace yourself... 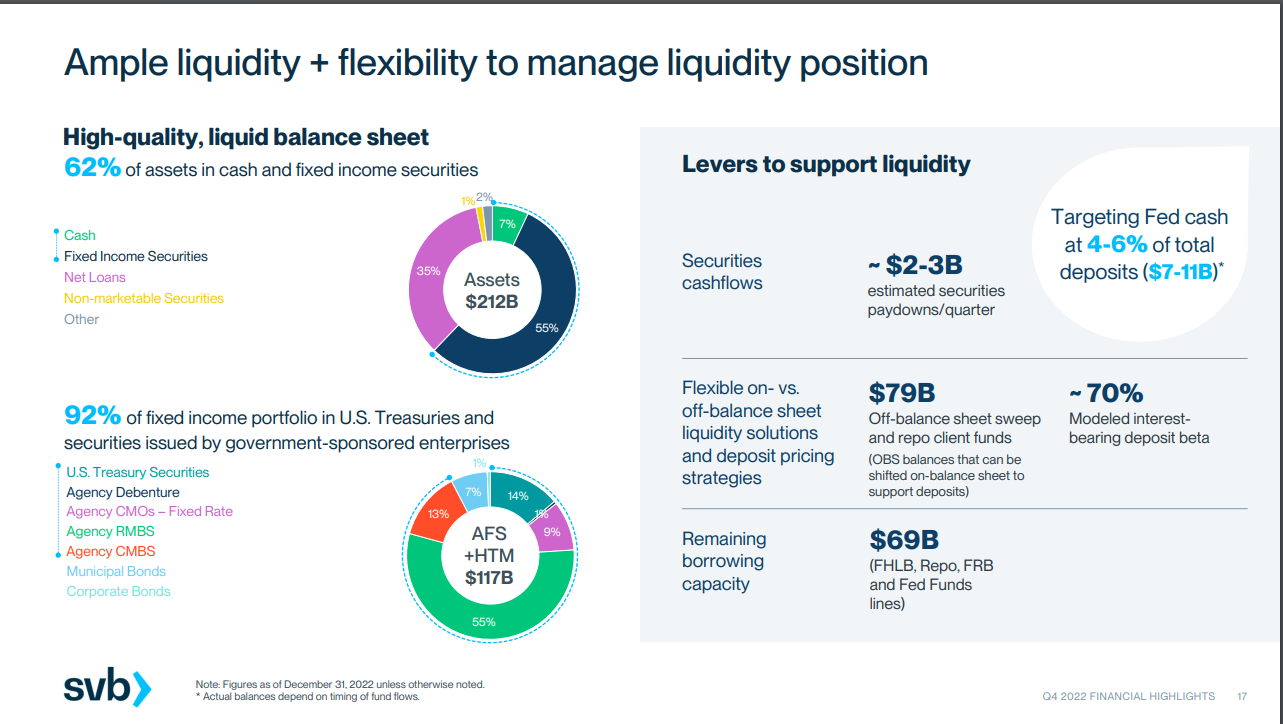
Interest Rates (Part III)Context: banks hold their securities in two buckets: Available to Sales (AFS) and Hold to Maturity (HTM). With HTM, if the value of your securities goes down, you don't take any loss on the balance sheet. It's held to maturity. With AFS, you take the loss on the balance sheet if the value goes down. As the interest rate increased, the value of those lovely "secure" assets SVB held dropped rapidly. Technically, any bank can be insolvent, but the balance sheet doesn't show. Now, we hit the real story! My educated guess: SVB realized that with the deposits not coming as fast, VCs not investing, everyone wanting interest & their assets losing value by the minute, they may be insolvent. What to do:
GOOD? No! Market Phycology & MechanicsMarket Psychology
The madness began, and market mechanics took over:
Some Observations (3/10/2023)That's what I have learned so far. Thanks for reading! Things may change, and new information may impact my conclusions. Here are some observations and lessons:
Hope you found this helpful! Fortune favors the intelligent! Hoda, Founder and CEO of StockCrd.io |
Categories
All
Archives
March 2024
|


 RSS Feed