Master your fundamental research. Join 79,627 investors who trust our platform and content.
Save 54+ hours of fundamental research with free access to Stock Card.
We only ask your name and email address.
|
Without a doubt, the U.S. stock market has staged a historical “recovery rally” since late March, regardless of the drastic price drop mid-June. The S&P 500 index erased all its losses for the year as of June 8. The Nasdaq index hit an all-time high past the 10,000 level the following day. There are various conjectures about what has fueled the rally. Some associate it with a possible wave of FOMO by the so-called Robinhood bros. Others believe that the optimism about the reopening of the economy has driven the rally. Regardless of what the catalyst is, a prevailing sentiment in our private Facebook community recently has been caution. What are the available choices to investors as they navigate the V-shape recovery, so far, and another possible sharp decline moving forward? How does an investor protect her gains, without sitting on the sidelines to let the volatility subside? In this blog post, Stock Card's Head of Data Science and a technical trader, Karen Sheng shares her thoughts and strategies that could be employed to address these questions, mainly using one general and three specific options strategies. 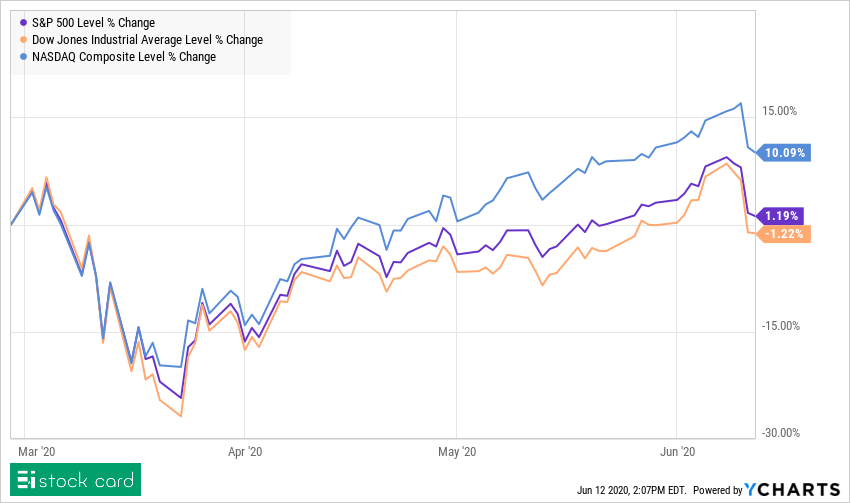 PART ONE: FOR ALL INVESTORS Cash is also a position! Cash is also a position - This is lingo that is commonly used in the traders' community. When a trader has low conviction about either direction of the market, one of the choices available is "going flat." This rule applies to investors who "buy and hold" as well. Doing nothing is a strategy worth considering, especially when there is doubt. Holding cash or selling to have cash come with a few important considerations:
This strategy is specifically important and easy-to-use by starter investors. However, for those willing to put the time and effort required to learn more sophisticated approaches, I'm sharing three possible hedge strategies using options. If you are a more advanced investor, read along. Before sharing the more advanced hedging strategies, have you heard of Public, one of the easiest and best-looking brokerage apps out there?  Promoted PART TWO: FOR MORE ADVANCED INVESTORS Protect long-term investments with three options strategies Many investors use options as a "hedge" strategy. This strategy allows the investor to continue investing while having the fallback option to recover possible losses in case the market takes the reverse direction, as it has done so in mid-June. For the rest of this post, I will focus on hedging with various options strategies, all of which have defined maximum risk and risk/reward ratios. All these options strategies assume that you are willing to lose all the premium paid for the trade. Consider it a premium that you pay for insurance to protect your investments against a downturn of the market. If the market keeps rallying, your long-term investments are safe for the time being, and yet you may lose all the debit you have paid for hedging. On the other hand, in the case of a correction or crash, the gains from the hedging trade may offset the losses from the long-term investments. Compared to the "staying in cash" approach, you get to keep the stock holdings in your portfolio for long-term investments.  For illustration purposes, I'm going to use options of SPY for the reviews below. The prices of both stocks and options reflect close prices as of the end of June 9. Furthermore, I want to limit the premium paid to each trade, as this is the money that I'm committed to losing completely. In practice, I usually set the maximum in the range of $150-$250 per trade. For illustration purposes, though, I'm going to set the maximum at a much higher level, $1000, because I would like to compare the P&L for comparable Delta. I'm assuming that you have some basic understanding of the components of options pricing. With that, let's get to it! Strategy one: A naked put option
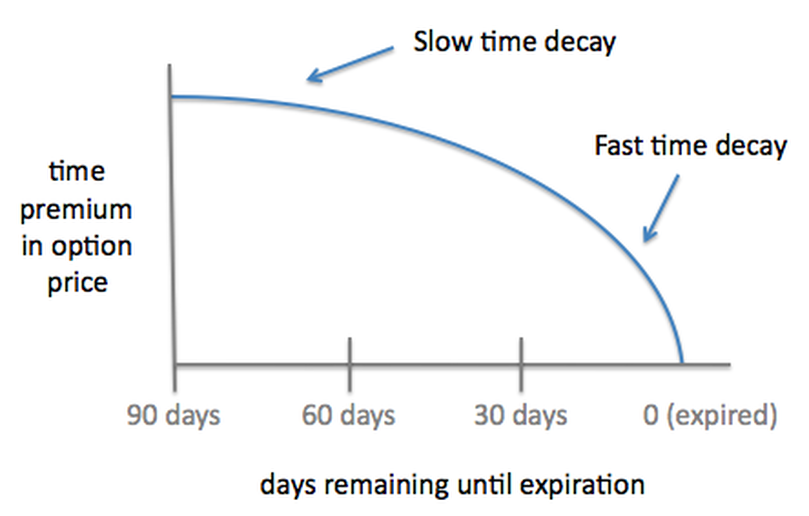
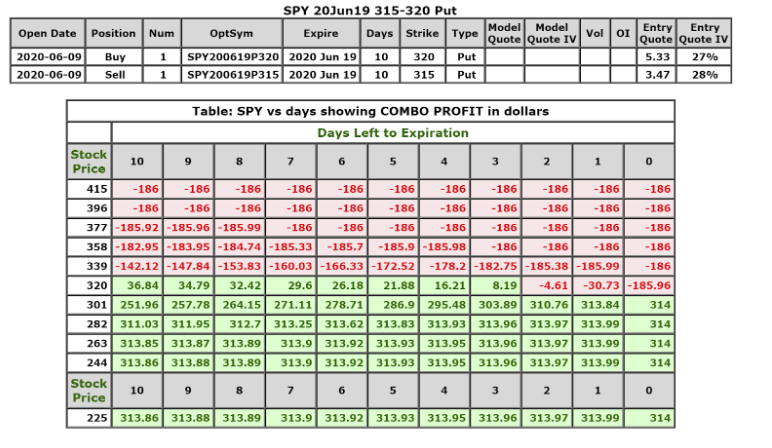
Example one - Buy an ATM (at-the-money) put option with 10 DTE (days to expire): I added two screenshots to explain how you go about buying this put option. The screenshot on the left shows a portion of the option chains. The maximum loss of this trade is the debit I'd pay - $582 plus any commission. The screenshot on the right is the projected P&L as of June 9. Note that if SPY starts to consolidate around the 320 level and doesn't make a significant downward movement, by 7 DTE (4 days from June 9), the trade would start to turn into a loss. 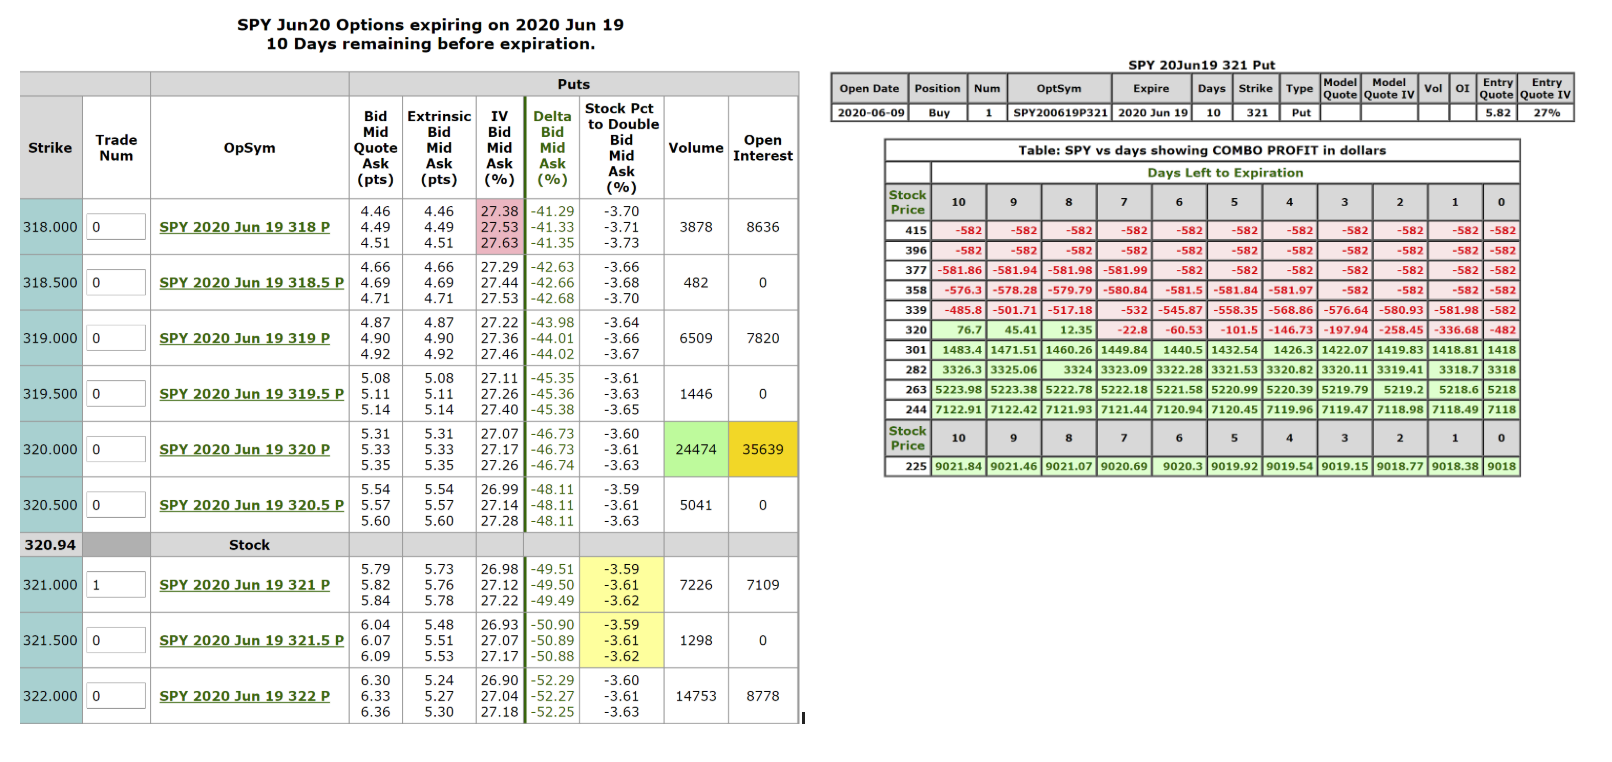 Example two - Buy an ATM (at-the-money) put option with 31 DTE (days to expire): The debit required for this trade per contract is $931, as the extrinsic value (time value) has almost doubled relative to the 10 DTE ATM contract. Recall the time-decay chart shown above. The time decay in this 31 DTE trade does not accelerate as fast as in the 10 DTE trade. Again, this is the projected P&L as of June 9. Notably, it's a break-even trade (zero loss, zero profit) if SPY consolidates around the 320 level by 22 DTE (9 days from June 9). The additional premium I'd pay gives me more time to wait for a pullback of the market. 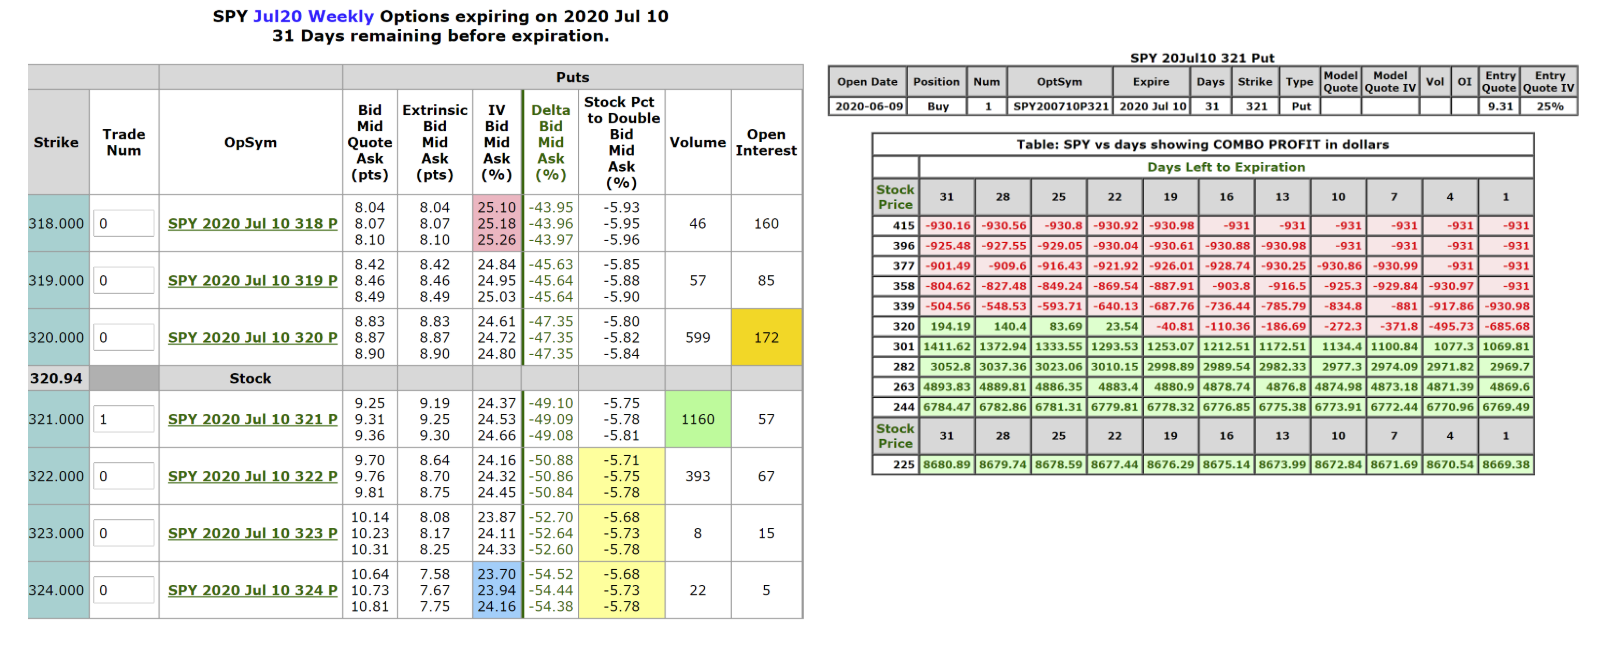 Strategy two: Construct theta-positive options trades Theta-positive, in plain English, means that the passage of time works in our favor. I'm going to review two theta-positive strategies - put debit spread and put calendar spread. Example - Buy a put debit spread with 10 DTE (days to expire): I'd buy the 320 SPY put option and, at the same time, sell the 315 SPY put option. The debit required for this trade is $186, and the risk/reward ratio is approximately 1:1.7. Note that the premium paid is significantly less than buying a naked put option. Furthermore, since the trade benefits from time decay, I don't mind placing a trade with fewer days to expiration. 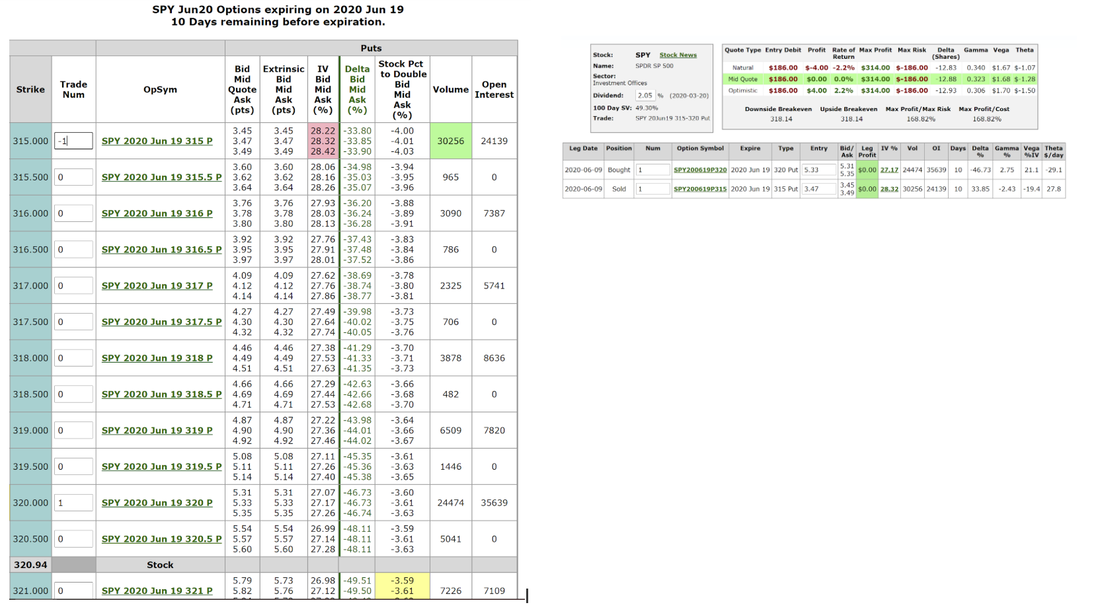
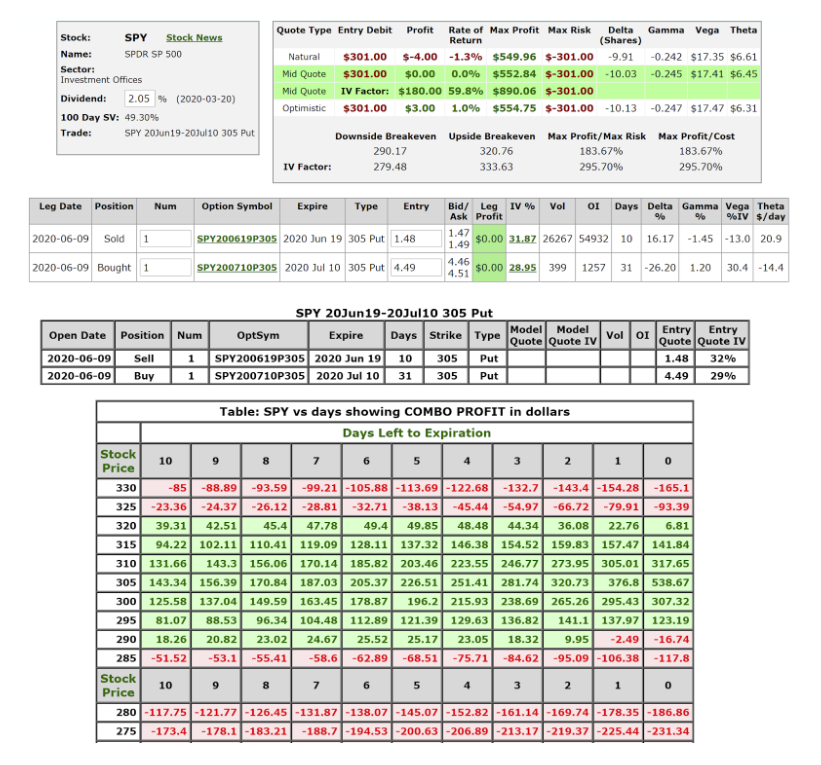
Strategy three: Buy an OTM (out-of-the-money) put calendar spread
Final words I hope you find these strategies and examples helpful. Don't forget the first thing I shared with you. Cash is a position too. You can always keep some money and only invest the money that will not endanger your financial well-being if you lose it all.
Comments are closed.
|
Categories
All
Archives
March 2024
|

 RSS Feed